
Applied replication for data skills
One day – social data science tools
Chris Moreh
Applied replication for data skills · a CodeMoreh workshop
A full-day workshop · four parts · the tools in the foreground
- Credibility and software – the crisis, the evidence, and five analysts whose code could be run
- The toolchain – languages, editors, plain text, the render pipeline, packages, and a first session in R
- The claim and its reproduction – the paper, its estimand and its causal graph, and a reproduction to the third decimal
- Exploration, preregistration and archiving – the specification menu, a preregistered analysis, and where finished work is deposited
You leave with: a working reproducible workspace · a reproduced result · a rendered report with a preregistration block · a map of the toolchain, with your own practice placed on it
Work along in your IDE, solo or in pairs, with the browser lab page as the fallback
Two kinds of aim
What I want you to understand
- What reproducibility, robustness and replicability each mean, and why they come apart
- Why plain text, a render step and a version history are what make an analysis checkable
- What an IDE, a document format and a package layer each do, and what none of them can do
- Why five analysts of one claim disagreed, and what made that disagreement diagnosable
- What preregistration settles, and what archiving and registering a reanalysis adds
What I want you to be able to do
- Set up and drive a reproducible workspace in the IDE of your choice
- Read a data frame, a pipe, a model formula and a rendered document, and write each of them
- Reproduce a published result to the third decimal from someone else’s materials
- Vary a specification one choice at a time and report what changed
- Preregister an analysis before you run it, render the report that contains it, and know where it would be deposited
What you do not need
- No git, and no GitHub account
- No OSF account – we will read OSF, not log into it
- No working installation yet: the browser lab runs R inside the web page, and Task 1 sets yours up
- Nothing to sign up for; nothing leaves your machine except the results you choose to submit
Do this now: open your workspace folder in your IDE, and open the browser lab in a tab beside it; R loads in the page while we talk.
PART 1 – Credibility and software
Part 1 · 90 minutes
What social science is for
Making claims about the world that could turn out to be wrong – and saying how we would know.
A claim is offered to others so that they can check it, use it, argue with it, build on it.
Science depends on that handover, and everything that follows is about whether it works.
False positives and forking paths
- The theory, 2005. With small studies, small true effects, flexible designs and many teams chasing the same question, most published findings in a field can be false with nobody breaking any rules (Ioannidis 2005)
- The demonstration, 2011. Give researchers only the flexibility they legitimately have – which cases to drop, which covariates to keep, when to stop collecting – and a false-positive rate of 5% becomes over 60% (Simmons et al. 2011)
- The subtlety, 2014. You do not need many tests. In a garden of forking paths, a single test chosen after looking at the data already has the wrong p-value (Gelman and Loken 2014)
Evidence from replications and many-analysts studies
- 100 psychology studies, replicated with high power and the original materials: 97% of the originals were significant, 36% of the replications were, and effect sizes roughly halved (Open Science Collaboration 2015)
- 161 researchers, 73 teams, one hypothesis on immigration and support for social policy: 1,253 models, and no convergence on either sign or significance (Breznau et al. 2022)
Different fields and different designs. In the first, most findings were not significant again in new samples; in the second, the result depended on who ran the analysis.
Incentives and questionable research practices
Fraud exists, but it is rare. The mechanism behind these results is ordinary and structural:
- Journals reward novel, clean, significant results – so that is what gets written up
- Every analysis contains dozens of small defensible choices, and the analyst makes them while looking at the data
- Nobody publishes the twelve specifications that did not work; the reader sees one
- Data and code are usually not available, so nobody can check any of it
Ask researchers anonymously, with an incentive to answer truthfully, and a majority admit to at least one of these ordinary practices (John et al. 2012)
None of these steps requires a dishonest person, so the problem cannot be fixed by hiring better people.
The red-card study
The question. Are football referees more likely to give red cards to dark-skinned players than to light-skinned ones?
The data. One dataset, sent to everyone: 2,053 players in the top divisions of England, Germany, France and Spain, the 3,147 referees they played under, and 146,028 player–referee pairs. Skin tone rated from profile photographs by two coders who did not know the research question.
The design. Twenty-nine teams analysed it independently. They reviewed each other’s approaches before anyone had seen a result, revised, and only then compared answers.
This is the first many-analysts study. Every one since is a variation on it, including the one that this course works on.
Silberzahn et al. (2018)
The twenty-nine estimates
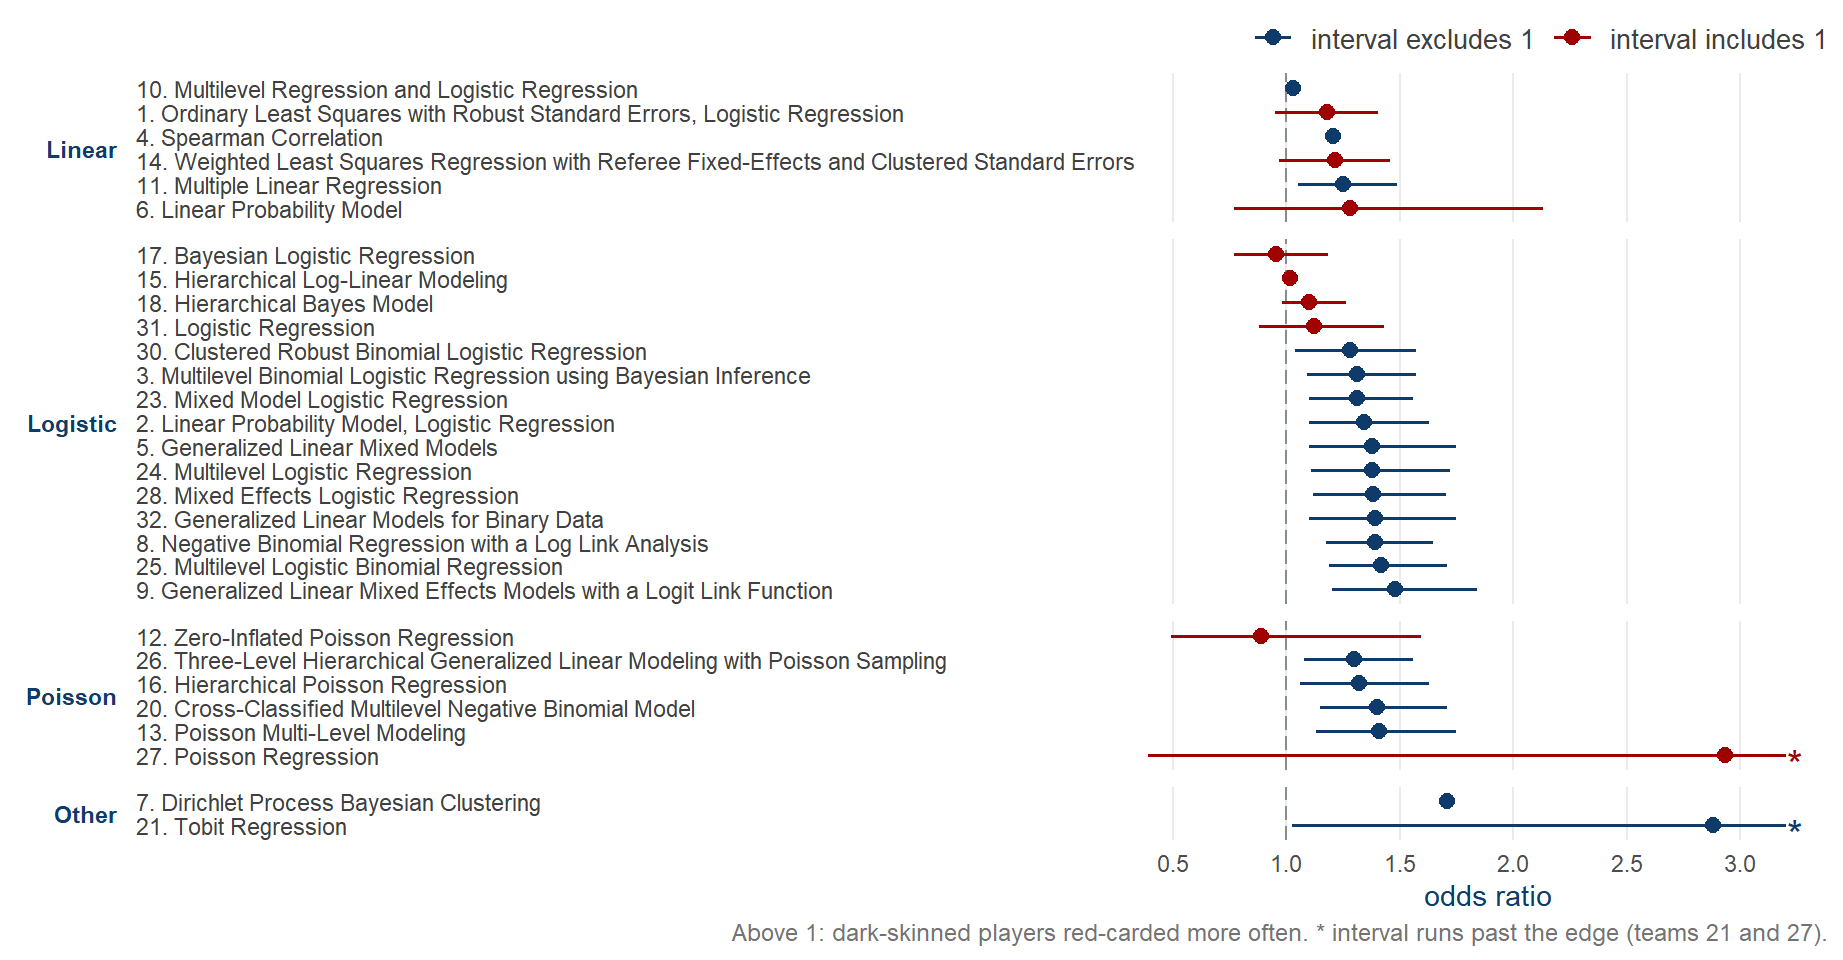
Silberzahn et al. (2018), Figure 3, rebuilt from the published values at osf.io/gvm2z.
Replication
crises
Another replication
crisis – terminological confusion?
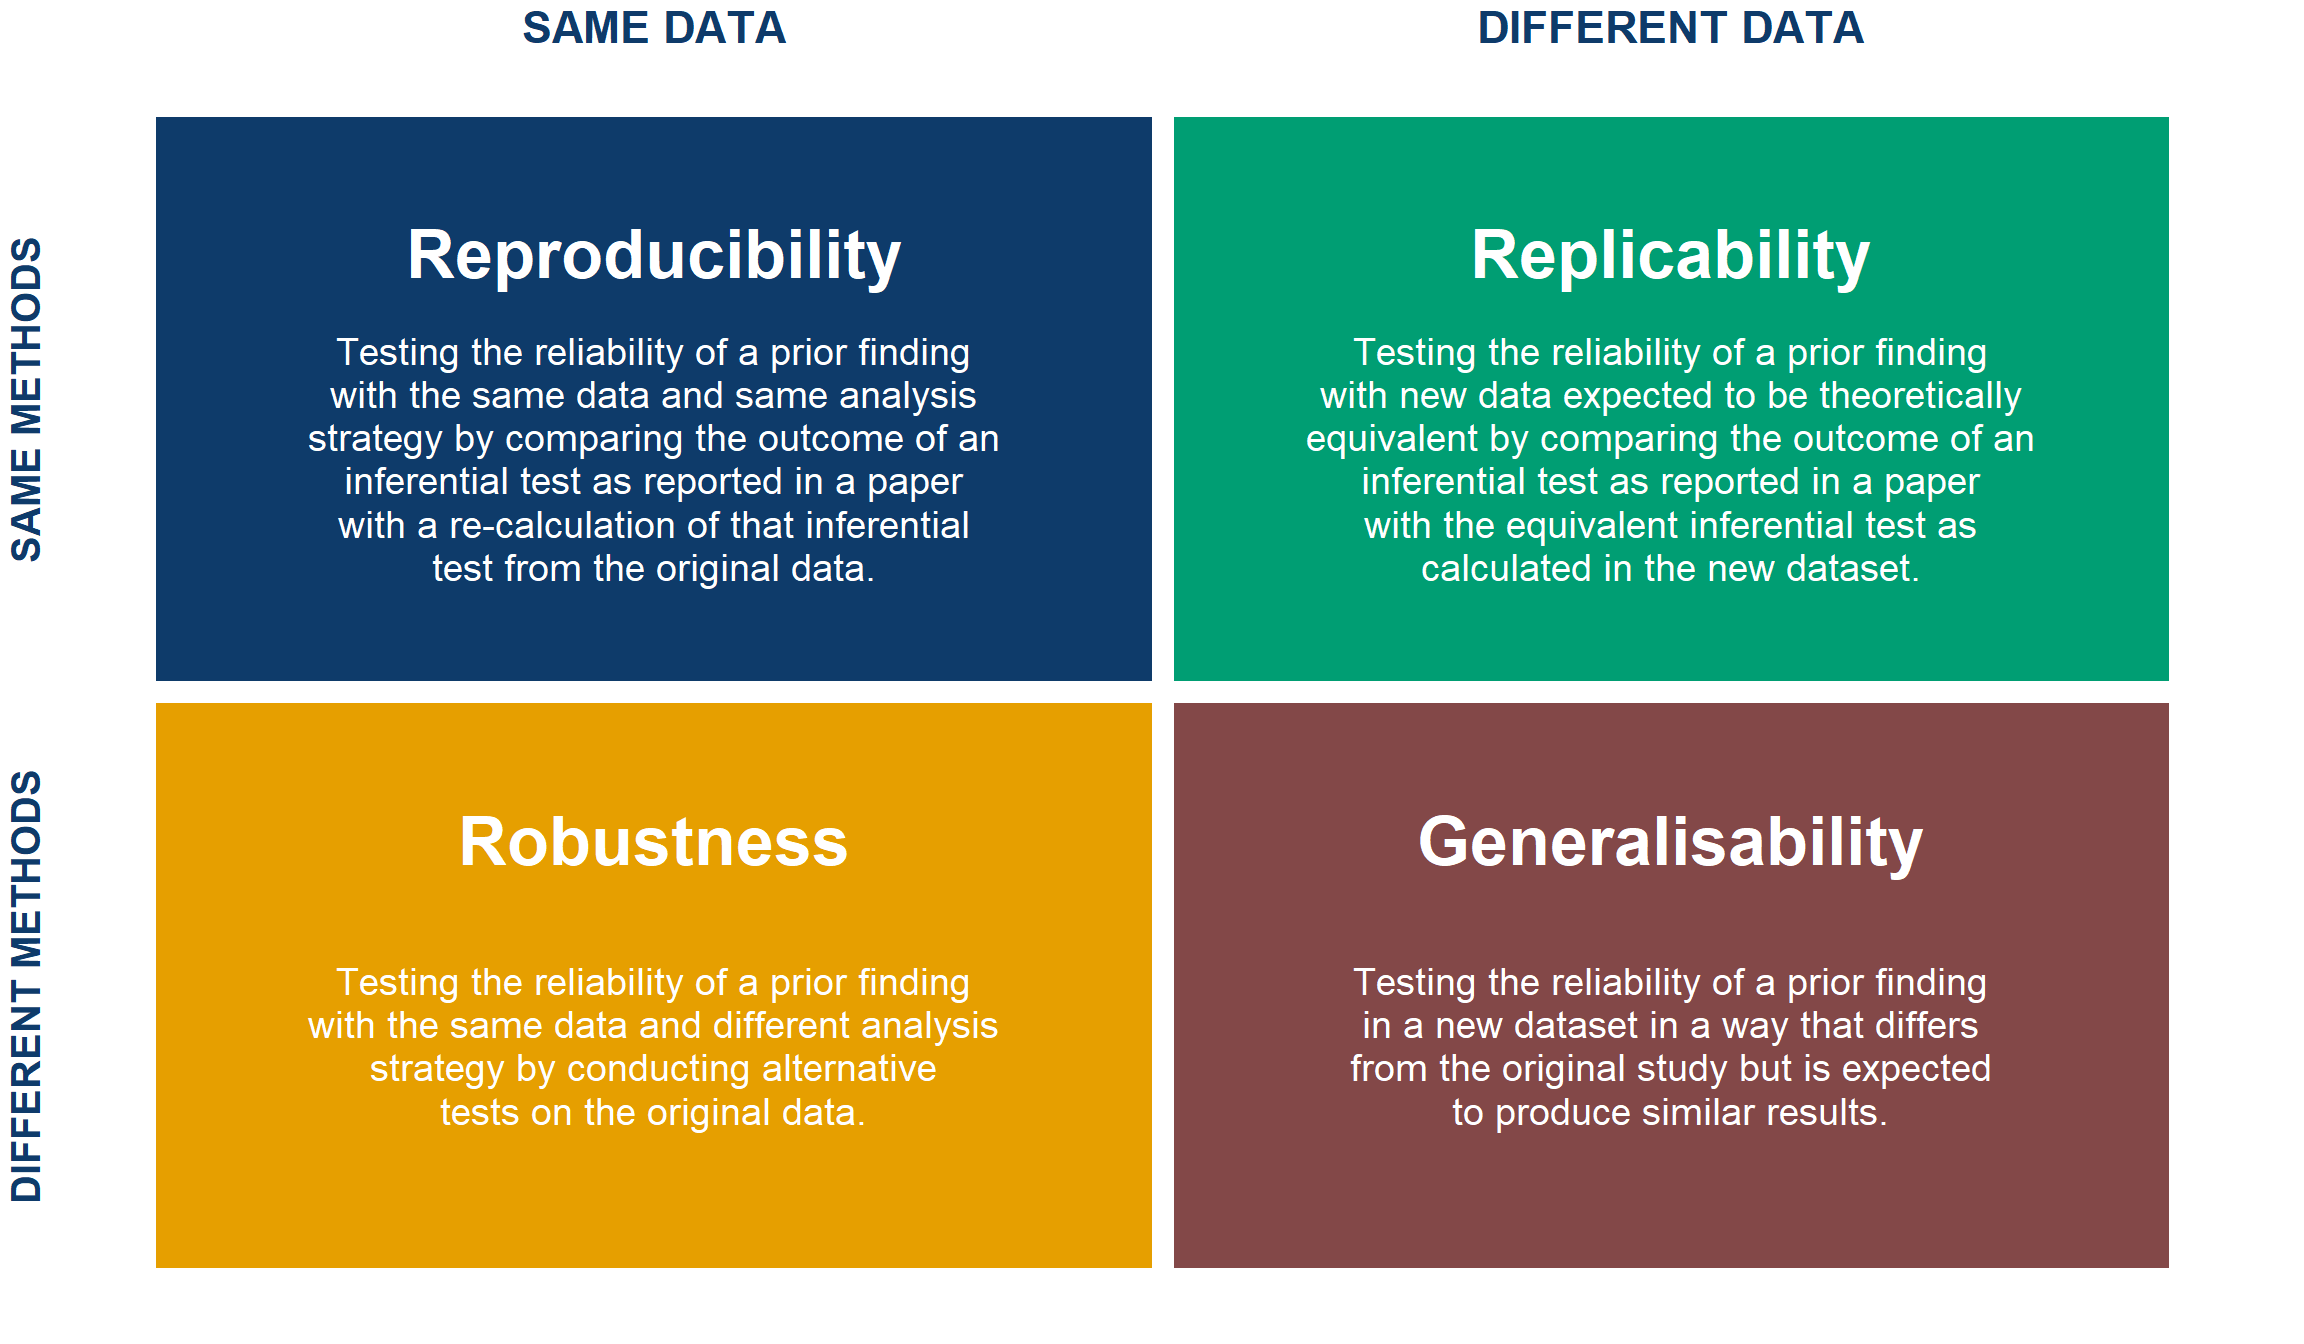
The term reproducibility
has been used as a synonym for a number of different characteristics – reproducibility, robustness, replicability, repeatability, credibility, and trustworthiness (Nosek et al. 2025, 2).
Successfully rerun the same code on the same data? Re-analyse the same data a different way? Collect fresh data and analyse it in the same way? Using the same data and same analysis but asking a different question? Asking the same question but answering it with fresh data and a different analysis?
The data \(\times\) analysis matrix
Repeatability and credibility
Repeatability is used when referring to reproducibility, robustness, and replicability as a constellation of concepts intended to assess whether answers to scientific questions are unchanged when different steps of the research process are repeated.
Credibility and trustworthiness refer to the confidence one can have in research findings. Because scientific knowledge claims are tentative, they are not synonymous with truth.
For example, credibility is advanced by addressing potential competing interests in the conducting and reporting of research, by taking existing knowledge into account, by using methods that have been validated, by controlling for biases in the research context, by pursuing precise and reliable evidence, and by calibrating the strength of the claims to the uncertainty of the evidence.
Nosek et al. (2025, 2)
Quick check – the matrix in peer review
You submit your paper and replication package. It goes out to reviewers.
Reviewer 1
wants to ensure that your results are reproducible, so she sources your R script to run the entire analysis. You’re in luck – she hasn’t yet updated herdplyr, so the code runs.Reviewer 2
is very eager. He’s unconvinced by your modelling choices, so he fits your data to another function to check if your findings are truly robust. You’re in luck again – he recovers your point estimate to a reasonable precision, although the confidence intervals have widened.Reviewer 3
takes a special interest because he’s just working on a similar paper on data they published recently. Do your results replicate when your methods are applied to that state-of-the-art dataset?
Quick check – the matrix in peer review
You submit your paper and replication package. It goes out to reviewers.
Reviewer 2
just doesn’t want to let go…
- He tried a few alternative analyses of your data, including a fancy new regression method that he just released as an R package. His method gives results that are generally aligned to yours, but for the method to work, it would require a larger dataset; would your results really generalise to this new dataset published by
Reviewer 3
that he just read about, if applying his new fancy method to it?
Open research: the practices
| Practice | What it makes possible |
|---|---|
| Open data | Someone else can re-analyse your evidence |
| Open code | Someone else can rerun your exact analysis |
| Open materials | Someone else can run your study again |
| Open access | Someone else can read the claim in the first place |
| Preregistration | A dated record of the analysis plan, filed in a registry before the results exist |
| Registered reports | Peer review of the plan, with publication decided before results |
Each one removes a specific obstacle, and none of them guards against every problem. The programme, set out at length: (Munafò et al. 2017)
The SCORE programme
- DARPA-funded programme to gauge the credibility of social-science claims
- A stratified sample of papers from 62 journals, published 2009–2018
- The central claim of each paper traced from the abstract to the statistic that supports it
- Thousands of researchers, and three repetition studies built on the same sampling frame
The three SCORE studies
SAME data
DIFFERENT data
SAME methods
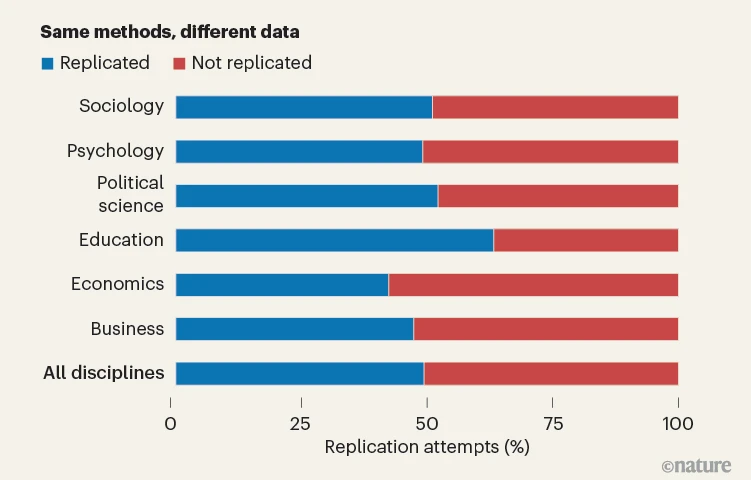
DIFFERENT methods
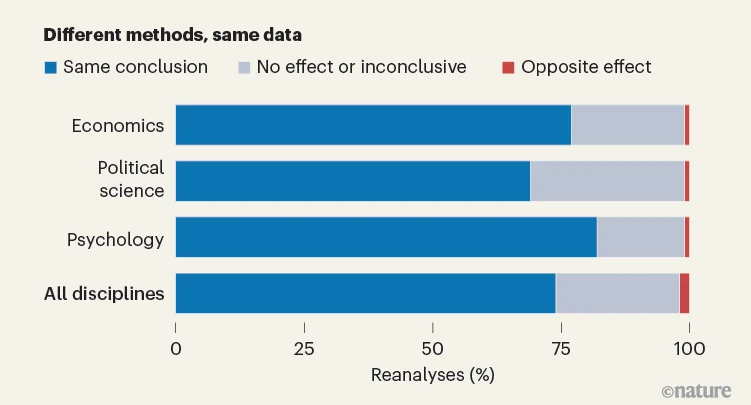

Sánchez-Tójar et al. (2026)
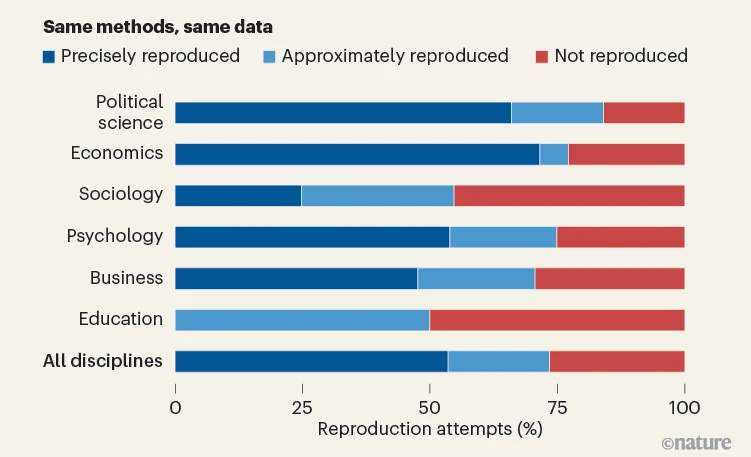
Reproducibility – Miske et al.
- 600 papers sampled (62 journals, 2009–2018)
- Ask the authors for data and code, then try to rerun the reported result
- How often is that even possible?
Miske et al. (2026).
Reproducibility results – Miske et al.
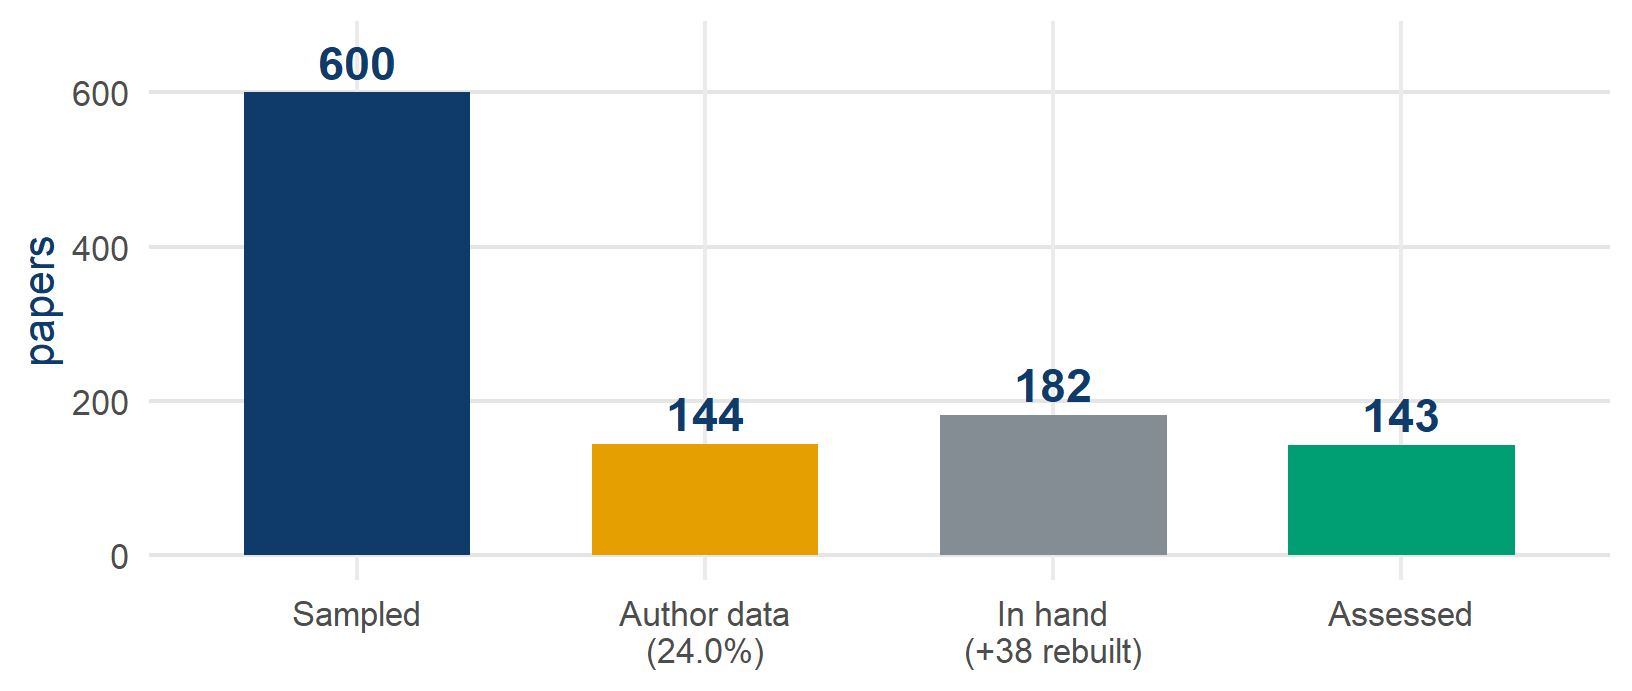
- Of the 143 assessed: 53.6% reproduced precisely, 73.5% at least approximately
- Counting the unassessable, only about 18% reproduce
Miske et al. (2026). Published counts: the 143 assessed papers come from 182 datasets, 38 of them rebuilt from source data.
Data availability – Miske et al.
- Journals with a sharing policy: 66.2–100% data availability vs 16.0% without
- By discipline: 54.1% data availability in political science vs 2.9% in education
- With data and code: 90.9% approximately reproducible vs 38.1% from rebuilt source data
The most substantial barrier … was the unavailability of author data.
Reproducibility success does not mean that the finding is correct.
Miske et al. (2026).
Robustness – Aczel et al. (Multi100)
- 100 studies, each re-analysed by ≥5 independent analysts
- The same data for every analyst, each free to choose any justifiable analysis
- A peer panel judges whether each pipeline is appropriate
- I was one of its analysts
Aczel et al. (2026).
Robustness results – Aczel et al.
- 34% of reanalysis effect sizes within ±0.05 d of the original (57% within ±0.20)
- 74% reached the same conclusion, 24% a null or inconclusive one, 2% the opposite
- Effect sizes shrank: original mean d 0.73 → reanalysis 0.49
- Analyst-to-analyst variability typically exceeds sampling error
Aczel et al. (2026).
Replicability – Tyner et al.
- 274 claims from 164 papers, tested on independent data (newly collected for 128, existing for 146)
- A median statistical power of 99.6%, a preregistered protocol, and the original authors consulted
- The strictest test: does the effect reappear in data that the original study did not use?
Tyner et al. (2026).
Replicability results – Tyner et al.
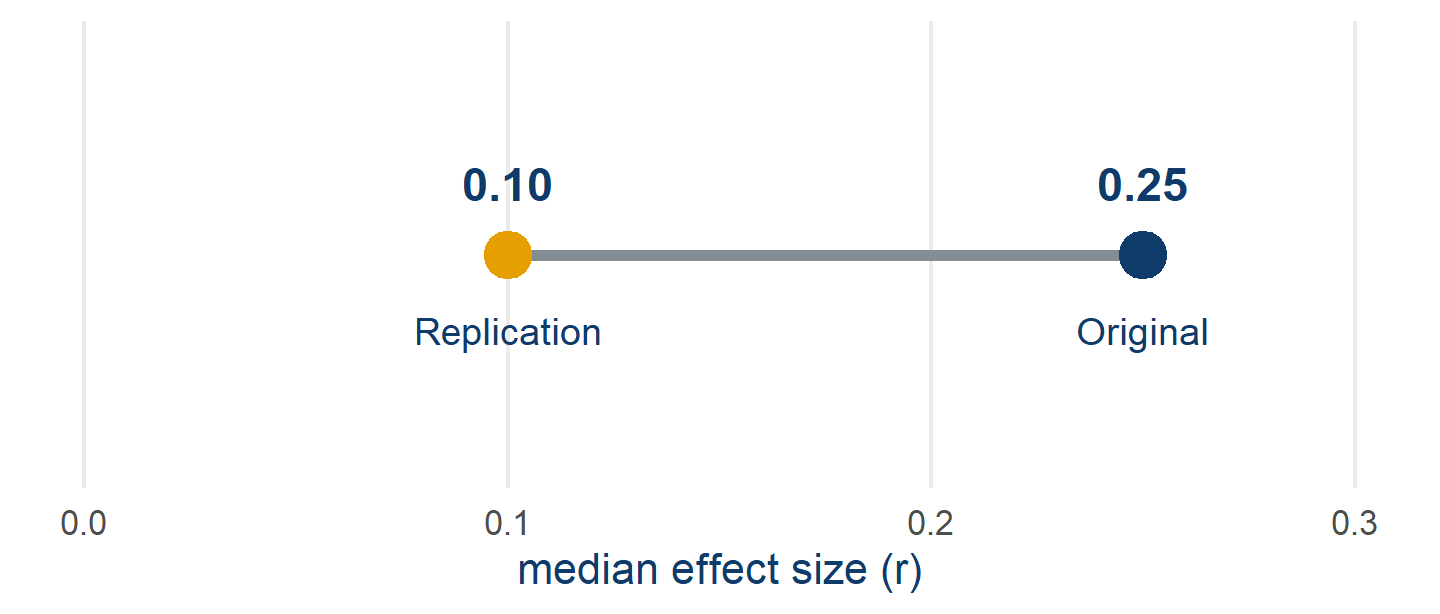
- 55.1% of claims replicated by the significance criterion, and effect sizes roughly halved
- Thirteen success criteria give anywhere from 29% to 75%
Tyner et al. (2026).
The three Rs across SCORE
Reproducible ≠ robust ≠ replicable.
Across SCORE the three are essentially uncorrelated – knowing one barely predicts the others.
So there is no single number for trust
. You have to ask which repetition you mean.
What a Multi100 analyst received
- A published paper, in full and not blinded, so I could see the original estimates
- Its central claim, in one sentence, lifted from the abstract
- A pointer to the data – in our case, sixteen Eurobarometer waves you fetch yourself from GESIS
- No instructions on method – any analysis you can defend
And two things I was not told: who the other analysts were, and what they were finding.
Aczel et al. (2026). Registered protocol: osf.io/7snkz
The paper in brief
- Author: I will say OA, the original author, from here on
- Does the EU economic crisis undermine support for the EU? – 16 Eurobarometer waves, 2004–2013, about 390,000 respondents in 27 countries
The results show, first, that poor economic performances increase negative and decrease positive dimensions of EU framing.
- Macro predictors: national unemployment and GDP growth. Outcome: what people say the EU means to them, sorted into four framing scales
Teney (2016). The full methodological reading comes later in the course.
The two Multi100 tasks
Task 1 – free reanalysis. Reanalyse the claim however you see fit. Record one categorical conclusion: does the evidence support it?
Task 2 – constrained reanalysis. Months later, three instructions arrive that fix the question:
- use the cosmopolitan framing dimension as the outcome
- use the unemployment rate as the predictor
- disregard the contextual variables
Task 1 measures whether we agree. Task 2 makes our numbers comparable – you cannot average five answers to five different questions.
Results on a common scale
- Every analyst reports their test statistic and its degrees of freedom, in whatever form their model produces – t, z, F, \(\chi^2\)
- Each is converted to a partial correlation r and a standardised Cohen’s d, so a pooled model fitted in Stata and a multilevel model fitted in R can be read on the same axis
- A peer panel judges whether each pipeline is an appropriate analysis of the claim
- Only then can you ask: how far apart are five defensible answers?
Standardising makes the comparison possible, but it assumes that the five are estimating the same quantity. Hold that thought until we come to estimands.
The five analysts – Task 2 results
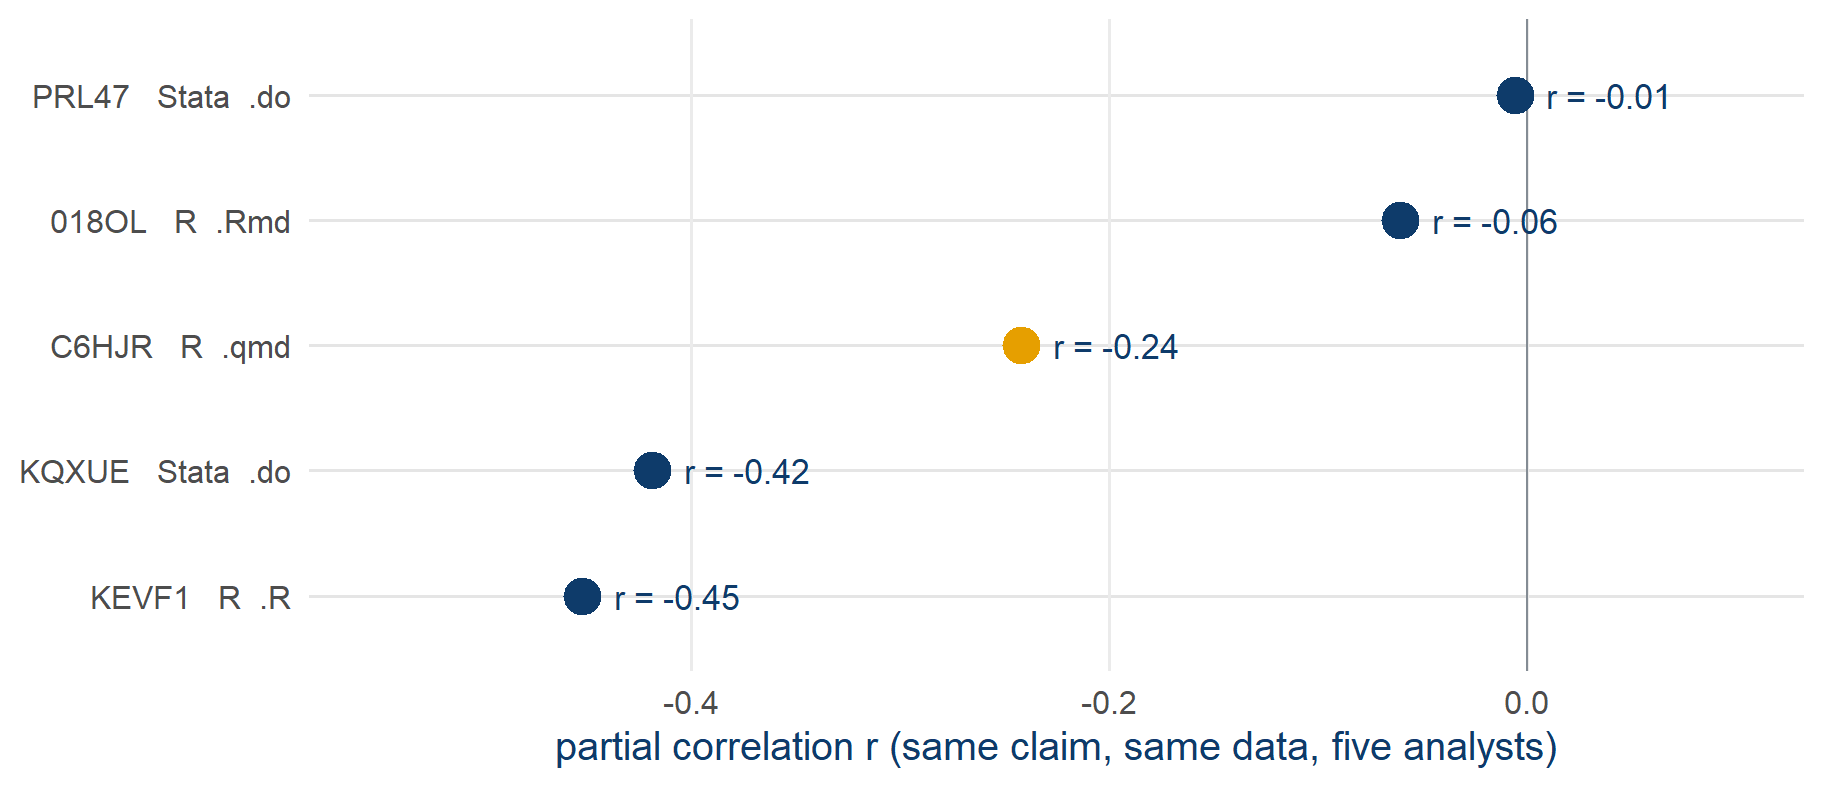
- All five estimates negative, with partial r from −0.45 to −0.006, and one of them not significant
Task 2 results as recorded in the public Multi100 dataset (osf.io/q5h2c).
Software and document formats
- Two of us worked in Stata, three in R
- Within R, three different document formats: a plain
.Rscript, an.Rmd, a.qmd
The software did not cause the spread. There is no Stata answer and no R answer to this claim.
But because each of us submitted a document that somebody else could open and run, it became possible, afterwards, to find out what did cause it.
That is what the toolchain is for.
Open-source software
- You can read it. The source of
lm(), offeols(), of every package that this course loads, is public, so no estimator has to be taken on trust - No licence stands between a reader and your analysis. Anyone, anywhere, can run your code without buying anything
- It outlives your institution. A licence expires when you change job; a package on CRAN does not
- You can fix it, and so can others. Bugs get found because thousands of people run the same code on different data
With a proprietary toolchain, the price of reproducing your work falls on your reader, who has to buy the licence.
The workspace and the browser lab
Your IDE and the workspace
- The workspace folder you downloaded, opened in your IDE (Positron, RStudio, VS Code, etc.)
- Quarto renders your report;
fixestfits your models - No git, no cloning, no configuration – it is just files
- This is what I drive on the shared screen
The browser lab
- One web page. R is compiled to run inside the browser
- Nothing installed, nothing to break, data already in place
- The same tasks, data and helpers, on the shared screen and in your own tab
- Your spare if your installation misbehaves at any point
github.com/CodeMoreh/replication-lab – download zip → unzip → open in your IDE
What the tools cannot do
A perfectly reproducible pipeline can be a perfectly reproducible answer to a question you never stated.
None of this software will tell you what your estimand is, whether your controls belong in the model, or whether the association you found means what you think it means.
Tooling is the cheap half of the problem, because it can be learned. The expensive half is the question that the analysis is meant to answer.
Hands-on 1 – The setup check
Task 1 – the setup check. Get to the point where a line of R runs and the data are in front of you.
- Workspace: your IDE opens the workspace folder, the packages install,
working_script.Rruns its first block, and the report skeleton renders - Browser lab: the page has finished loading, the first chunk runs, and
euframeshas 270 rows
Take the time you need, into the next break if necessary. Type a green circle in chat when you are through; type STUCK and I will come to you.
If your installation will not cooperate, do not fight it – open the browser lab and carry on. Nothing in the tasks depends on which one you use.
Break
30 minutes – the return time is in the chat · keep setting up if you need to
PART 2 – The toolchain
Part 2 · 90 minutes
The toolchain
Analyse
 Rstatistics-first language
 Pythongeneral purpose, good for machine learning
 Juliafast numerics

 Stata / SPSSproprietary, still standard in places
Write
 Positronthe course default
 RStudiothe familiar one
 VS Codeeverything, via extensions
 Jupyternotebooks, Python-first
Publish and share
 Quartotext + code → anything
 Gitevery version, dated
 GitHubwhere the repository is hosted

 OSF / Zenodoarchive with a DOI
Ringed in orange: the tools that this course uses. The others are there so that you know what you are choosing between.
Programming languages
RBuilt by statisticians for data analysis. Hard to beat for models, tables and figures, thanks to its packages.
PythonA general language that also does data. Better for pipelines, scraping, text and machine learning.
JuliaFast, young, small ecosystem. Worth it when your model takes hours.
StataExcellent panel and survey estimators, superb docs, one syntax. Costs money and hides its source.
You do not have to choose once and forever. Quarto runs R, Python and Julia chunks in the same document, and the course browser lab is R compiled to run inside a web page.
Editors and IDEs
PositronThe newer IDE from Posit. R and Python as equals, VS Code underneath.
RStudioStill excellent, still supported. If it is what you know, use it.
VS CodeDoes anything, once configured. Big extension ecosystem.
JupyterNotebook-first. Beware: cells can run out of order.
 NeovimFor the keyboard-only. Steep to learn, and very fast once learned.
Of the choices in the toolchain, the editor matters least. It changes how you work and nothing about what a reader receives.
A trap: a notebook lets you run cells out of order, so it can show output that no clean run would produce. Restart and run everything before you believe it.
Positron and RStudio are both from Posit; both are free, and RStudio is open source.
Plain-text file formats
 .RCode only, with prose in comments.
 .mdProse only. Headings, lists, links – no code.
 .RmdProse + R, rendered together. R only.
.qmdProse + R, Python or Julia. The course format.
Every one of these is a plain text file. You can open it in anything, compare two versions of it line by line, email it, and read it in twenty years. A .docx with pasted output is not plain text, and nothing in it records which numbers came from which code.
What happens when you render
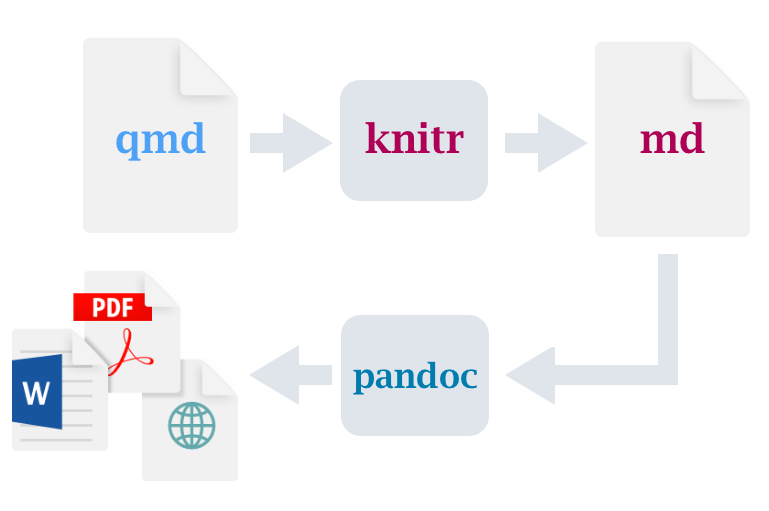
You write one source file. Rendering runs your code, inserts the results, and produces whatever output you asked for from that one source.
The package layer
 tidyverseReading, reshaping, plotting. One grammar across all of it.
 easystatsModel output as tidy data: parameters, performance, effect sizes.
 modelsummaryRegression tables you can publish, from the fitted objects.
 marginaleffectsPredictions, contrasts and marginal effects from almost any model.
The tasks also use fixest (fast fixed effects – the estimator behind our baseline), dagitty and ggdag (causal graphs). The full setup is on the setup page, and the check script in your workspace reports whether all three are installed.
Version control
Git is a program on your machine. It records a complete, dated snapshot every time you say so, and it never forgets one.
GitHub is a website that hosts those snapshots so other people can reach them – and it is not the only one (GitLab, Codeberg, one hosted by your university).
What it gives you that a folder of final_v3_REALLY_final.R cannot:
- Every past state, recoverable exactly
- A written reason attached to each change
- A public, timestamped trail of when you knew what
- A way for two people to edit the same file without one overwriting the other
The tasks use none of it. There is a companion module on the site, and your workspace folder is the ideal thing to practise on.
Where data and code are archived
OSFProjects, files, and registrations. Free, and it hosts the public record of our case.
ZenodoCERN-run archive. Gives a DOI; takes a GitHub release directly.
 DataverseInstitutional data archives with proper metadata and curation.
XYZDomain archivesGESIS, UK Data Service, ICPSR – licensed access to survey microdata.
A repository is not an archive. A GitHub repository can have its history rewritten, be renamed, or be deleted tomorrow. An archived deposit gets a DOI, a fixed version, and a commitment to keep serving it. Serious work usually needs both.
Licences, briefly
| What | Common choice | Why |
|---|---|---|
| Code | MIT · GPL | MIT: use it however you like. GPL: and share your changes back |
| Data | CC0 · CC BY | CC0 puts it in the public domain; CC BY asks for attribution |
| Text, figures, slides | CC BY · CC BY-NC | Attribution, optionally no commercial reuse |
| Someone else’s data | their terms | Eurobarometer is GESIS-licensed – I may not redistribute it, and neither may you |
Publishing with no licence is not a neutral default. It means all rights reserved – legally, nobody may reuse the work at all.
R, in one slide
With four pieces of syntax you can read most R: assign with <- · call a function with name(...) · reach into an object with $ · chain with the pipe |>.
Getting data in
What comes back is a data frame: a rectangle, one row per observation, one column per variable, each column of a single type. Almost everything in R takes a data frame and gives you one back.
library() makes the functions in a package available. It does not install it – that is install.packages(), and it happens once, not every time.
Inspecting the data
Every serious error I have made in twenty years of this was visible in the data before it reached a model – a duplicated year, a missing value coded as -9, a scale running 1–10 where I assumed 0–1.
Working with rows and columns
Read it downwards as a sentence: take the panel, then keep 2008 onwards, then keep four columns, then add a centred unemployment column, then sort by unemployment, highest first.
The sixth verb is summarise(), usually with group_by(): collapse many rows into one per group. That is how the panel you are working on was built from 390,000 respondents.
Model formulas
The tilde ~ reads outcome on the left, predictors on the right. Add predictors with +. The formula is an object in its own right and is not tied to the function that will eventually use it.
Almost every modelling function in R takes this same shape: something(formula, data = ...). Learn the pattern once and lm, glm, lmer, feols and betareg all become variations.
Fixed effects with fixest
The bar | separates the regression from the fixed effects. Everything after it is absorbed: cntry gives every country its own intercept, year gives every year its own.
The equivalent with dummies would be mcosmo ~ unemp_c + factor(cntry) + factor(year) – same estimate, 36 extra rows of output you do not want to read.
This is the model that you reproduce in Hands-on 3, where it gives t = −3.804.
Reading what comes back
- estimate – a one-point rise in unemployment goes with a fall of 0.00347 on a 0–1 framing scale
- std.error – how much that estimate would wobble across repeated samples
- statistic – the t: the estimate divided by its standard error. Roughly, how many standard errors from zero
- p.value – how often you would get a t this large if the true value were zero
broom::tidy() returns the table as a data frame, so you can filter it, join it, plot it. That is how 840 model fits become one chart when we reach the multiverse.
Plotting with ggplot2
Three parts, always: the data, the mapping (aes) from variables to visual properties, and one or more geoms that draw something. Layers stack with +.
facet_wrap repeats the whole plot once per group. One line of code gives twenty-seven small country panels, and you can see which countries move.
Causal graphs in R
Each line is one arrow, read outcome-first, following the same convention as a model formula. Because every arrow has its own line, you can comment one out with a # and the code still runs.
adjustmentSets() returns the variables that close every back-door path in the graph. Change an arrow, rerun, and watch the answer change.
Common error messages
| What you see | What it usually means |
|---|---|
could not find function "feols" |
The package is not loaded – add library(fixest) above |
object 'euframes' not found |
You ran this chunk before the one that creates it – go back up and run in order |
object 'unemp_c' not found |
The column does not exist yet – you skipped the mutate() that makes it |
+ on the console, nothing happens |
An unclosed bracket or quote. Press Esc and look for the missing ) |
Read the error. R error messages are terse but almost always literally true, and most of them name the thing that R could not find.
Lunch
An hour – the return time is in the chat · lunchtime browsing, if you like: the exercise overview
PART 3 – The claim and its reproduction
Part 3 · 90 minutes
The original paper
- 16 Eurobarometer waves, 2004–2013; about 390,000 respondents in 27 countries
The results show, first, that poor economic performances increase negative and decrease positive dimensions of EU framing.
What does the EU mean to you personally?
- COSMOPOLITAN: positive non-materialist form of EU framing (
Peace
;Democracy
;Freedom to travel, study and work anywhere in the EU
;Cultural diversity
;Stronger say in the world
) - UTILITARIAN: positive materialist form of EU framing (economic prosperity and social protection)
- COMMUNITARIAN: negative non-materialist form of EU framing (
Loss of our cultural identity
;More crime
;Not enough control at external borders
;Unemployment
) - LIBERTARIAN: negative materialist form of EU framing (
Bureaucracy
;Waste of money
)
- COSMOPOLITAN: positive non-materialist form of EU framing (
Teney (2016).
The claim card, as analysts received it
… poor economic performances … decrease positive dimensions of EU framing
Teney (2016: 619)
- Published coefficient – unemployment → cosmopolitan framing, Table 3 Model 1:
- b = −0.00340 · t = −4.03 · p < .001
The model OA fitted
- The unit is a person, not a country-year: roughly 390,000 respondents
- Thirteen response options collapse into four framing scales – cosmopolitan, utilitarian, communitarian, libertarian
- A three-level model: respondents inside country-waves inside countries
- Individual covariates: sex · age · education band · occupational status · urbanisation · left–right placement
- Macro predictors: unemployment rate and GDP growth, entering at the country-wave level
- Plus cross-level interactions – does the macro effect differ by education?
Published coefficient, Table 3 Model 1 – unemployment on cosmopolitan framing: b = −0.00340 · t = −4.03 · p < .001
Teney (2016).
Model 1 and Model 2
- Model 1: unemployment → cosmopolitan framing · b = −0.00340 · t = −4.03 · p < .001
- Model 2: the same coefficient, with further controls added – drops by more than half and loses significance
Within one paper, support for the claim depends on which of the two models you read. The paper reports both, which is more than many do.
That matters for the tasks, because the sixth analyst’s problem – which defensible specification do I report? – was already live inside the original study, before any of us arrived.
OA’s data and the course panel
OA’s data
- ~390,000 respondents
- 16 waves, 27 countries
- GESIS-licensed: I may not redistribute it
- Models take minutes
The course panel – EUframes_cy.csv
- 270 country-years, one row each
- The framing scales, averaged within each country-year
- Freely shareable, ships with the workspace and the browser lab
- Models take milliseconds
The aggregate panel addresses the contextual question directly: does a country’s framing move when its unemployment moves? It cannot address the compositional one, which asks whether the same people are framing differently or the mix of people has changed. There is a companion module that takes that up on simulated individual data.
Attempts to reproduce the paper
- Data: openly available but not freely redistributable
The required data to replicate my analyses can be downloaded on the Gesis repository website. I am not allowed to forward the Eurobarometer data. Enclosed you´ll find the code to combine the different Eurobarometer data waves and the code for the analysis of the ESR piece
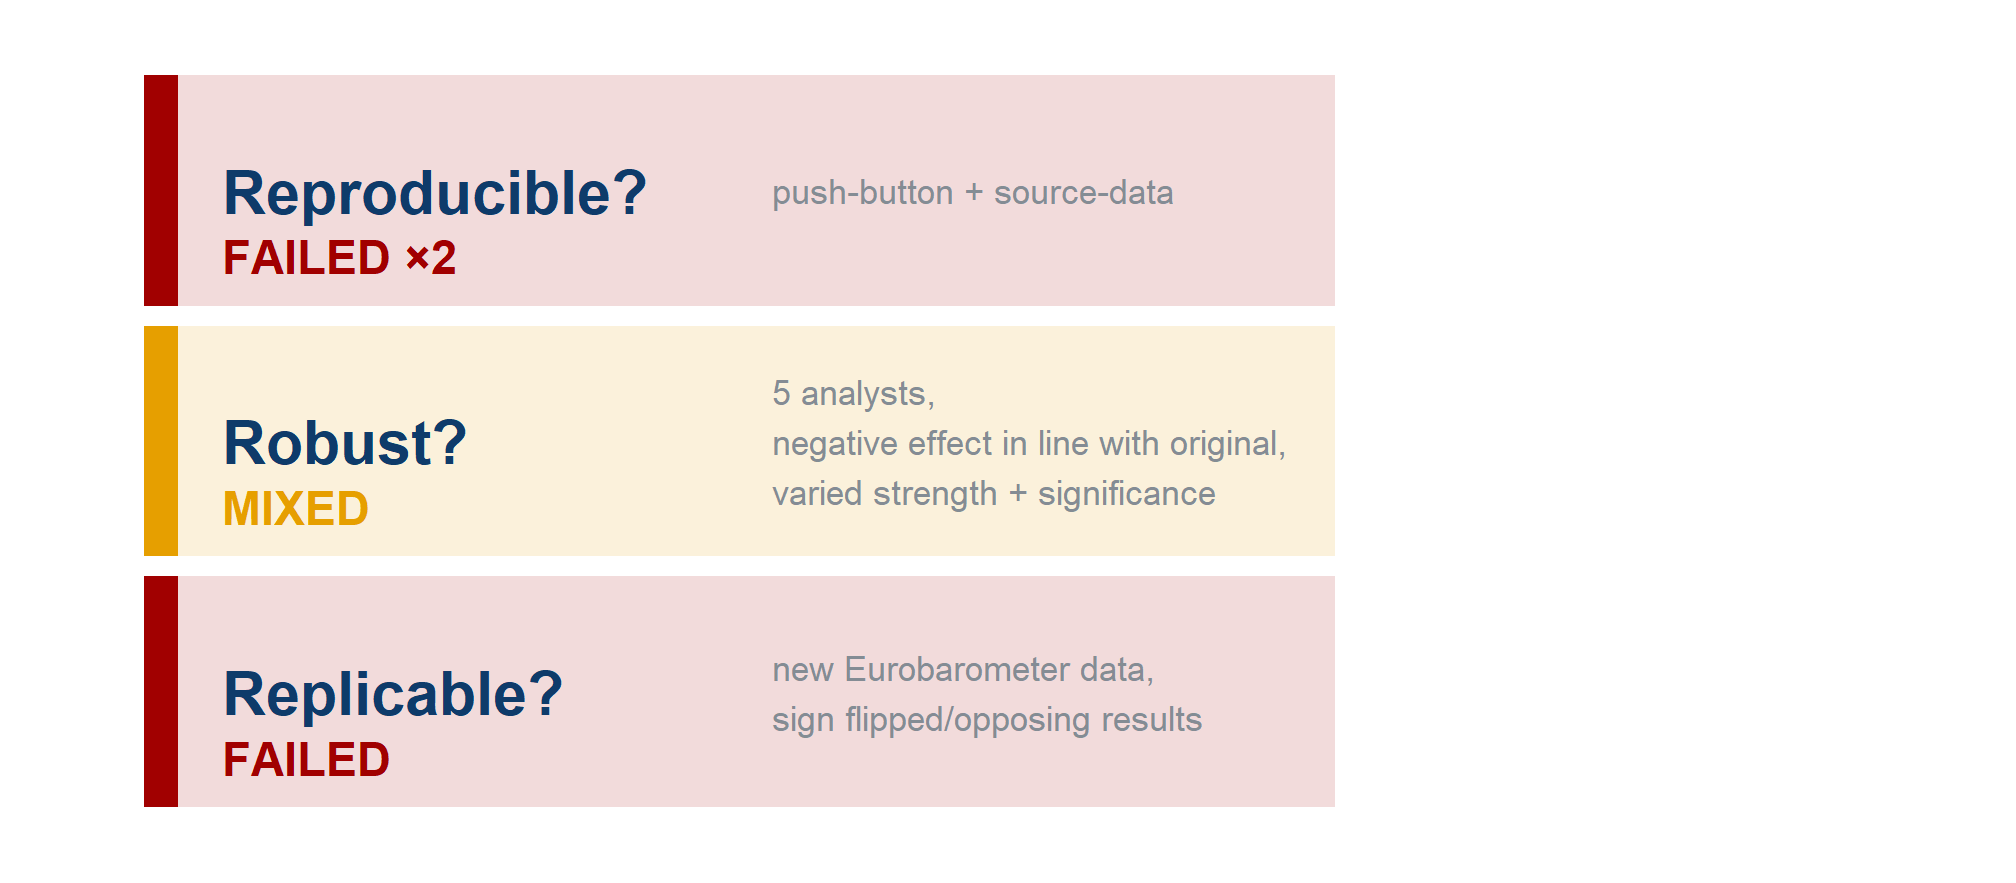
- Code: push-button reproduction failed
The reproduction attempt failed because the authors used file names that did not correspond with the names of the files available for download. Additionally 16 datasets are listed on the website as being used but the code references 18 files
- Source-data reproduction (rebuild from raw) –
not reproduced
: could neither extract nor re-calculate the original effect size
Replication on new data
Analysis One – the focal test on which SCORE evaluates the claim
- 352,114 person-year observations in the analytic sample
- b = 0.002, p = 0.046, se = 0.0008, t = 2.004
Analysis Two – the
still studying
andno full-time education
categories in the variableage when finished full-time education
were not converted to missing values- 379,396 person-year observations in the analytic sample
- b = 0.002, p = 0.017, se = 0.0007, t = 2.394
Both give a positive coefficient for unemployment on cosmopolitan framing, significant at p-values of 0.05 or less, after controlling for selected predictors and for wave and country-level effects
By the criteria used by SCORE, Analysis Two did not replicate the claim
The three Rs on this paper
The five free-phase analyses
| Analyst | Free-phase predictor | Free-phase outcome | Estimator |
|---|---|---|---|
| 018OL | GDP per capita (level) | positive framing, 7-item mean | crossed random intercepts |
| KEVF1 | GDP growth | positive framing, 7-item sum | random intercepts |
| PRL47 | log GDP + growth + crisis dummy | three positive-framing shares | three-level mixed |
| KQXUE | GDP growth and unemployment | cosmopolitan + utilitarian shares | country FE |
| C6HJR | GDP growth and unemployment | positive framing, 7-item share | two-way FE |
- Five free analyses, five different questions – three of us never touched unemployment at all – and one shared recorded verdict:
evidence for the claim
- The constrained phase then manufactured a common question; its five comparable answers span −0.006 to −0.45
- Conclusions can agree while estimates cannot even be compared – the two robustness questions that Multi100 was built to separate (Aczel et al. 2026)
Free-phase records: the public Multi100 dataset (osf.io/q5h2c), which contains only categorical verdicts and free-text reports. The models themselves were read from the analysts’ public code.
Theoretical and empirical estimands
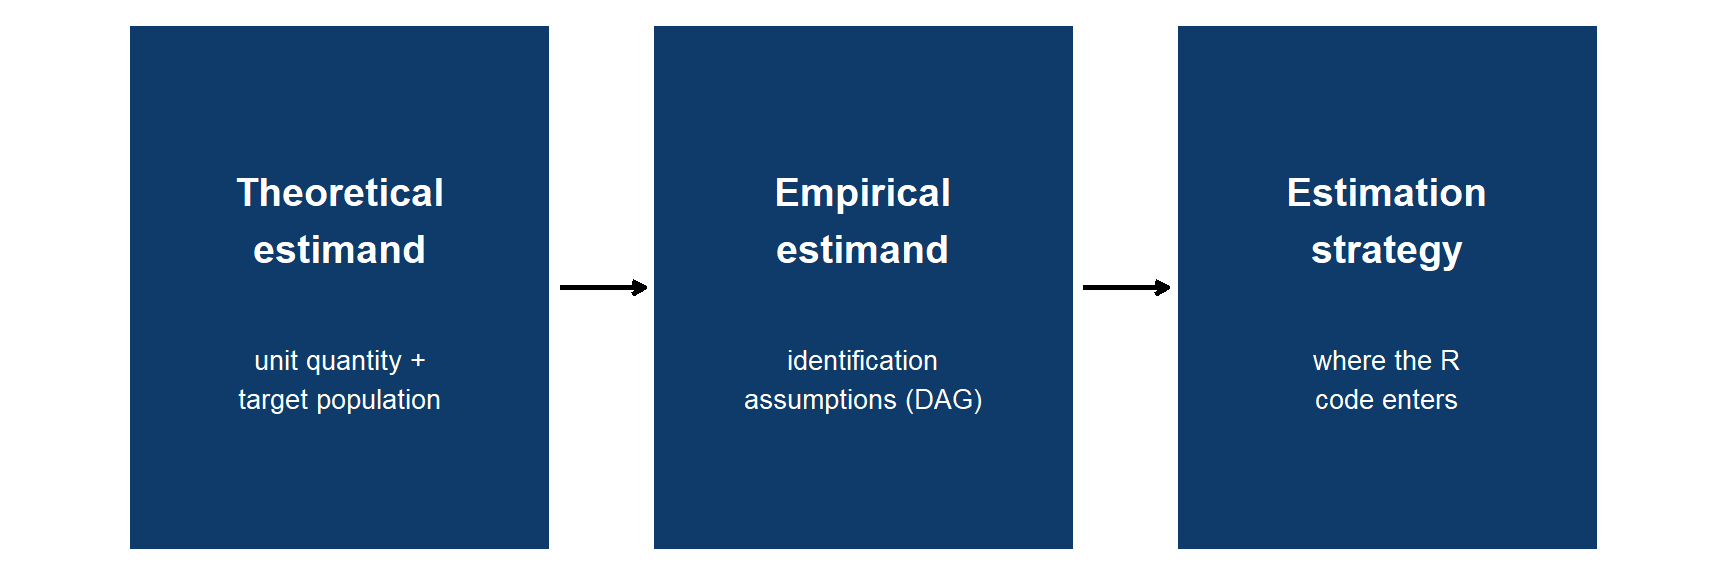
- The theoretical estimand is stated outside any model – before R opens
Lundberg et al. (2021).
Confounders, mediators and colliders
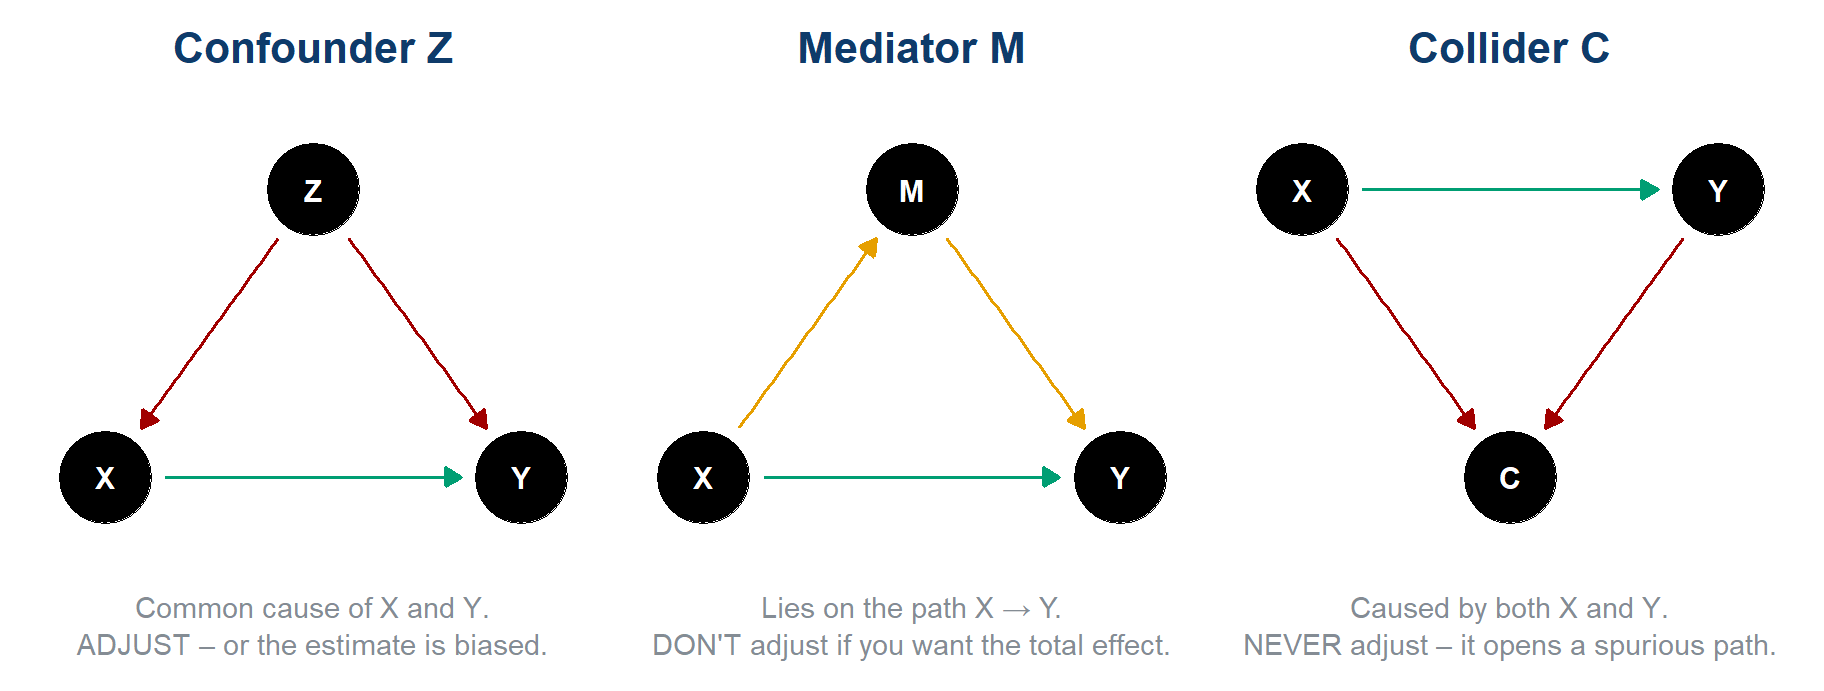
X = predictor, Y = outcome. Green = the causal effect you want; coloured = the path you must reason about.
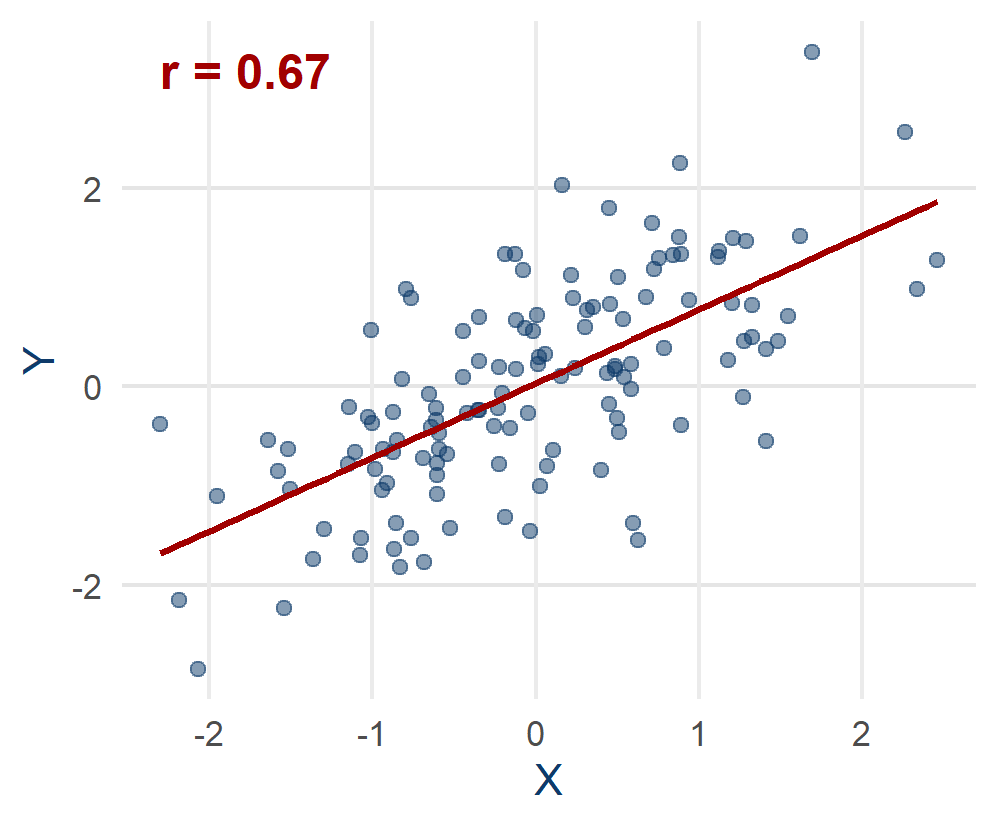
Causal stories behind a correlation
The same slope fits four different stories:
- X really causes Y – the slope is the effect
- a common cause inflates it – confounding
- the sample itself is selected – collider / selection
- Y causes X (reverse causation), or it is chance
The data look identical in all four. Only an assumption about how the data arose can tell them apart, and a DAG is where you write that assumption down.
Reading a DAG: open and closed paths
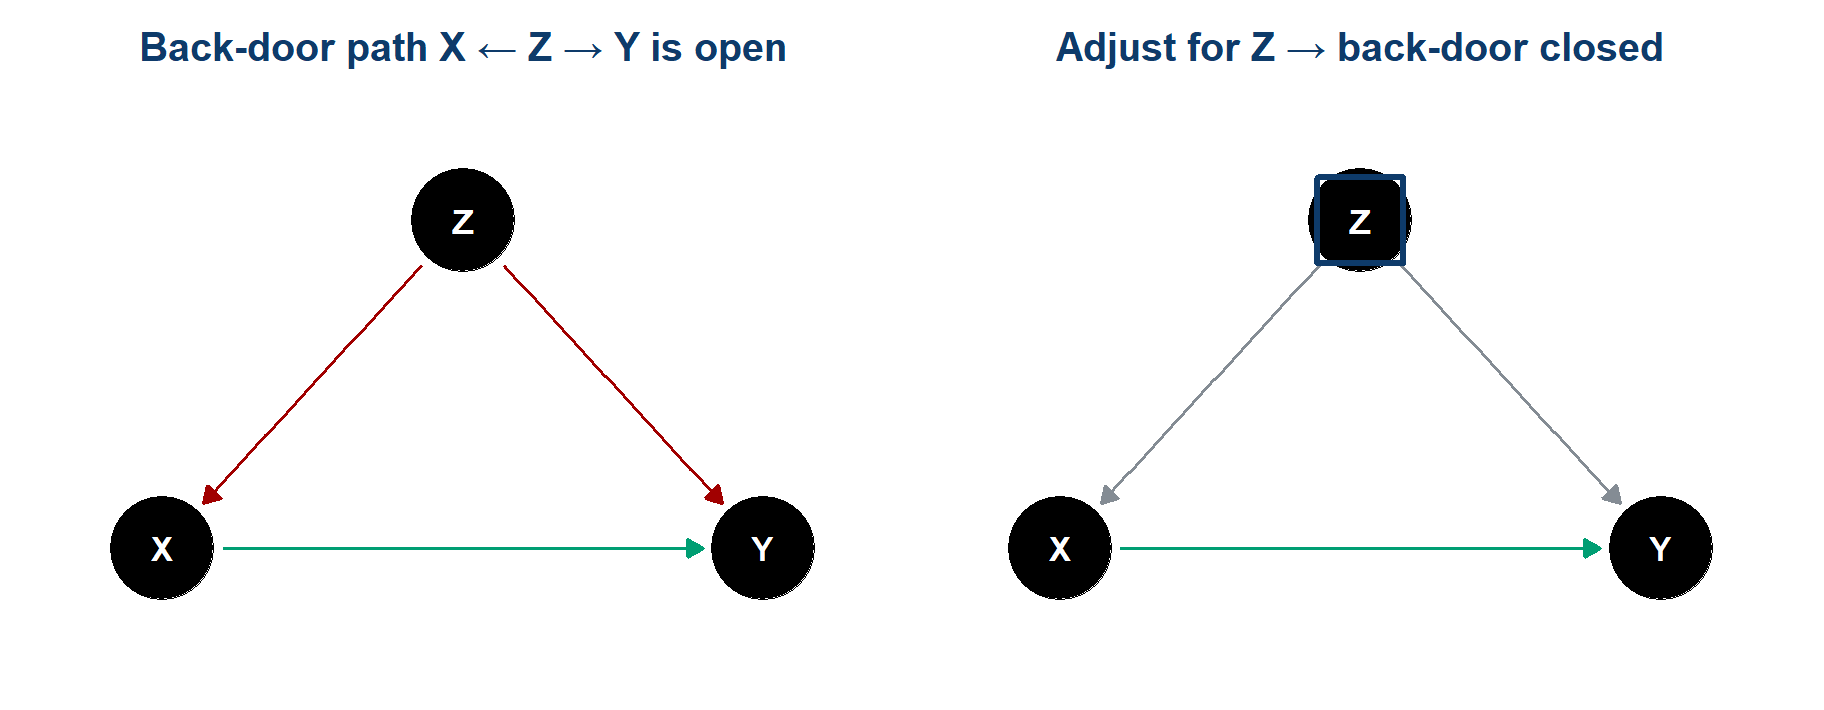
Association flows along every open path, not only along the causal arrow. A fork or a chain is open until you adjust for the variable in its middle. A collider is the reverse: shut by default, and opened when you adjust for it.
- Back-door criterion: close every path that enters X from behind, keep the causal X → Y path open
- Only an adjustment set that does this supports a causal reading
Total effect or direct effect
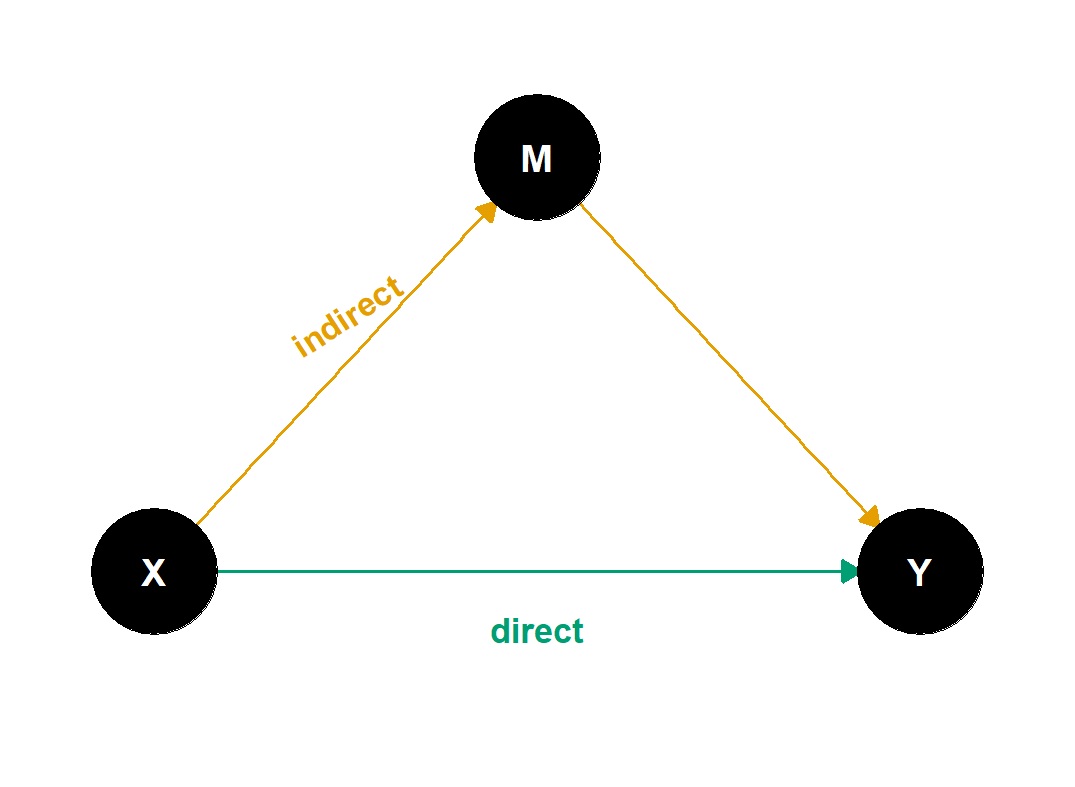
- Total = direct (green) + indirect (amber)
- Adjust for the mediator M → you estimate the direct effect only – a different estimand
Control for everything
can switch you to an estimand you never chose- Table 2 fallacy: the other coefficients in your model are not all causal effects
Selection and feedback
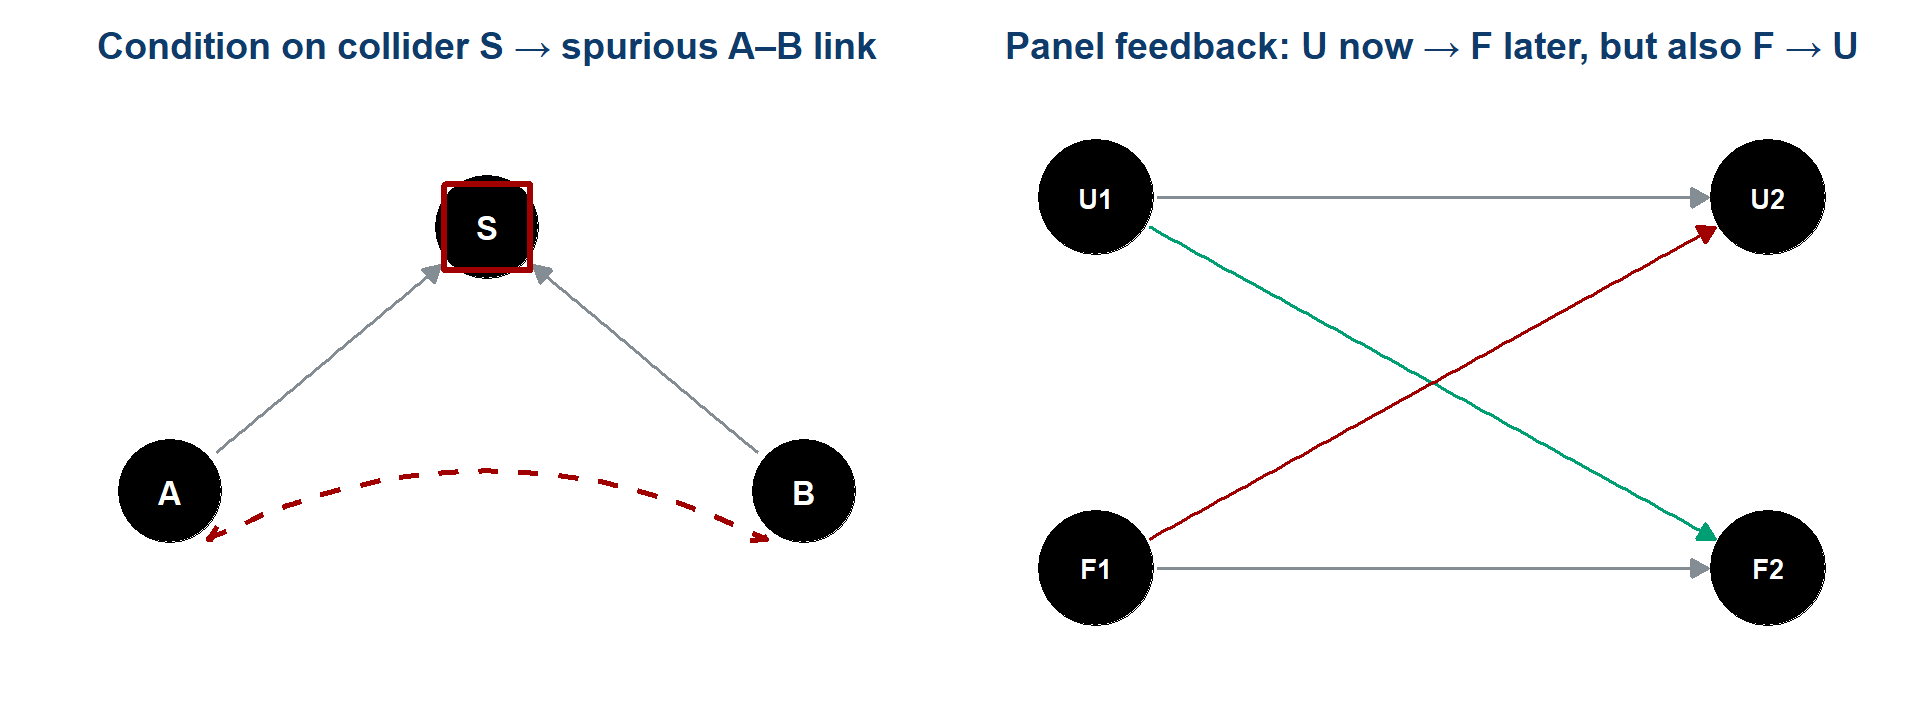
- Selection / collider bias – conditioning, or merely sampling, on a common effect manufactures an association that was never there (much of the early COVID risk-factor literature)
- Reverse causation & feedback – in a panel, today’s outcome can move tomorrow’s predictor; two-way fixed effects absorb stable country traits and common-year shocks, not time-varying feedback (U = unemployment, F = framing)
Revenons à nos moutons
The expected change in [unit quantity] among [target population] for a 1-percentage-point difference in unemployment, holding [assumptions] fixed.
- Unit quantity – a person’s cosmopolitan framing, or a country-year mean?
- Target population – which countries, which years?
In chat, now: your one-sentence estimand for the claim. Type it, hold it, send on go
.
Causal identification in this design
Observational panel · 27 countries · no assignment mechanism · feedback between the variables · a decade of shared shocks.
Nothing in this design licenses unemployment causes a shift in EU framing
.
So why draw a causal graph at all?
Because the graph still does three jobs that do not need identification:
- It says which association you are after – for instance the total effect, rather than whatever the software returns
- It tells you which variables belong in the model, and, just as usefully, which do not
- It makes your assumptions legible and arguable – a reader can disagree with an arrow, and that is a productive disagreement
Publishing the estimand and the graph
The graph and the estimand are only worth anything if they are published where someone else can read them:
- in the paper itself
- before the model runs, not reconstructed afterwards
- with the limitations named by you before a reviewer finds them
In Task 5 you enter all of that in a block of the report in your workspace – the estimand, the graph-based justification, the one specification, and the rule for what would count as support – and you do it before you run the model.
The technical name for that is preregistration, and it fixes the question before anyone knows the result.
The EU-frames DAG, half built
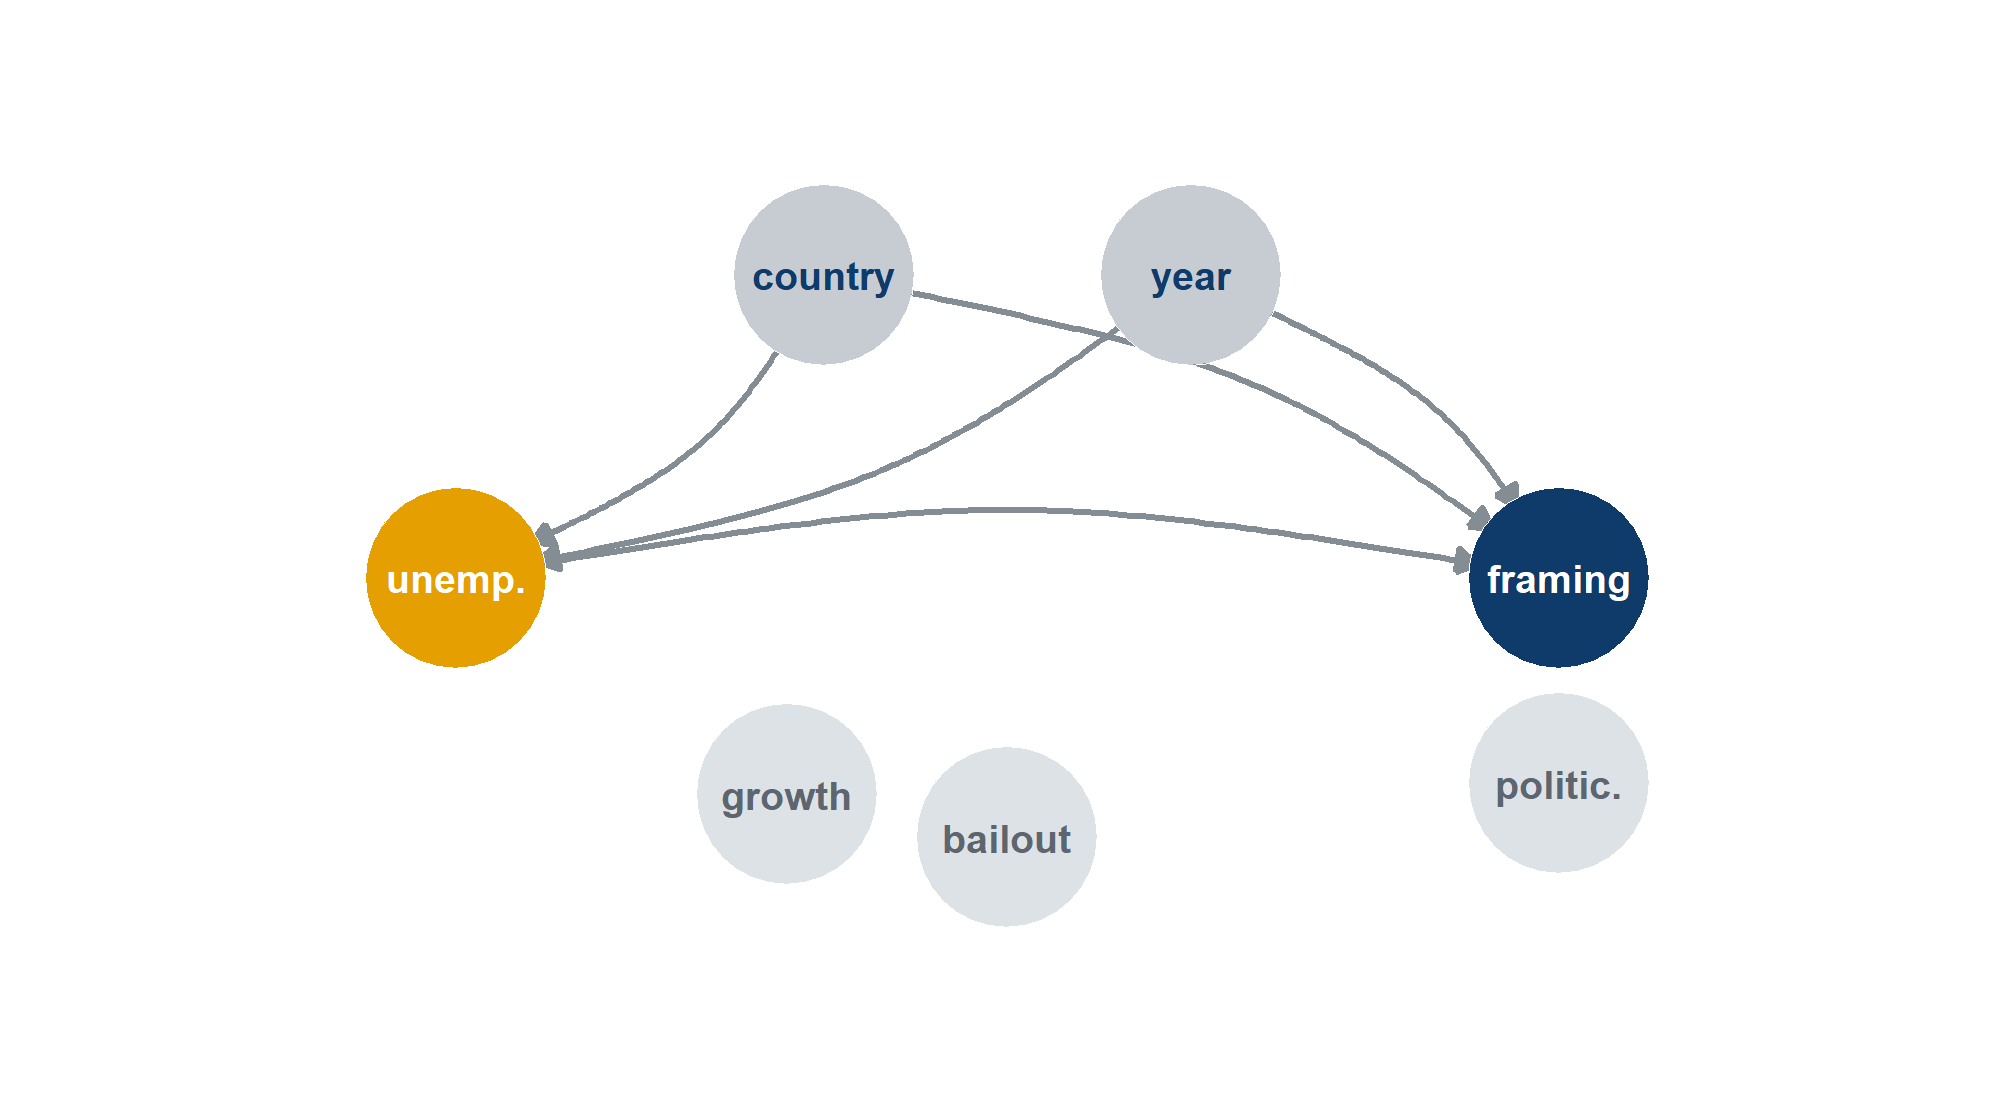
The same graph in R. Every arrow is a formula, read outcome-first – so a # takes an arrow out and the code still runs:
- Drawn: the path of interest and two confounders, country and year, which two-way fixed effects adjust for
- Not yet wired: growth (confounder?) · bailout (mediator?) · politicisation (mediator?)
- Your part: add the edges you believe, then run
adjustmentSets()
Hands-on 2 – The panel, the estimand and the causal graph
Task 2 has three pieces:
- Look at the data. 270 rows, 27 countries, 10 years. Run the country panel plot and find the ones that move
- Write the estimand in words. The template gives you the unit quantity, the target population, the aggregation – fill in each for this claim
- Wire up the DAG. Take the
#off the arrows you are willing to defend, rerunadjustmentSets(), and check which adjustment set it now returns
Two sentences for your notes: what do two-way fixed effects adjust for, and what can they not fix?
Whatever you decide here becomes your starting point on the menu in Task 4, and the justification you preregister in Task 5.
Task 2 of Multi100
Focus on the
Cosmopolitan
dimension for EU framing and on the unemployment rate as the independent variable; disregard contextual variables.
Three instructions. Everything else – estimator, sample, weighting, functional form, how you build the scale – was left to us.
Multi100 was designed to fix just enough to make the numbers comparable and to leave the rest free, so that what remained would be a measurement of analytical variability itself.
What those three instructions assume
The cosmopolitan dimension
assumes that the five items form one scale, and that the summary used in the paper, each respondent’s share of mentions, is the right one. A mean, a sum, or a factor score would all be defensibleThe unemployment rate
assumes that the claim is about unemployment. The abstract of the paper sayspoor economic performances
– which also names GDP growthDisregard contextual variables
removes the country-level controls. That makes results comparable across analysts and gives up any defence against a time-varying confounder
None of these is wrong. Each one is a decision, made for you, that a different study could reasonably have made differently.
The EU-frames panel
EUframes_cy.csv – 270 rows, one per country-year · 27 countries · 2004–2013
| Column | What it is |
|---|---|
cntry, year |
the cell |
mcosmo |
mean cosmopolitan framing in that country-year, 0–1 |
mutil, mcomm, mlib |
the other three framing scales |
mpos, mneg |
the two composites – all positive items, all negative items |
unemp, growth |
national unemployment rate and GDP growth |
n_cy |
how many survey respondents are behind the cell |
bailout |
1 if an EU/IMF assistance programme was running |
n_cy is the interesting one: cells are built from very different numbers of people, which is why weighting is a live choice on the menu.
Analyst no. 6
- Aim 1: reproduce analyst C6HJR’s constrained result
What Multi100 asked: focus on the
cosmopolitan
dimension and on the unemployment rate; disregard the contextual variablesWhat I submitted: a two-way fixed-effects model,
mcosmo ~ unemp_c | cntry + yearWhat Multi100 recorded: t ≈ −3.80 (df = 233, N = 270, partial r ≈ −0.242)
Hands-on 3 – Reproducing the recorded result
- Task 3 in your workspace or in the browser lab – the constrained specification: outcome
mcosmo, unemployment centred, country and year fixed effects - The data are one file,
EUframes_cy.csv, loaded as the objecteuframes - In the working script the model is written out for you to run; the browser lab version has gaps to fill, with two hints and a full solution
Target: t = −3.804 – the value recorded for analyst C6HJR in the Multi100 dataset. When you have it, type your t in chat and hold it until I say go
.
Reproducibility and analytical choice
Thirty of you just got t = −3.804, to the third decimal. That is reproducibility, and it is the easy R.
You all ran the same code. The five Multi100 analysts each wrote their own and came back with five different answers.
None of them was careless. They made different choices, and the options that they chose from make up the menu.
Break
30 minutes – the return time is in the chat · leave the Multiverse page open
PART 4 – Exploration, preregistration and archiving
Part 4 · 90 minutes
The specification menu
| Axis | Options |
|---|---|
| Outcome | mcosmo · mutil · mcomm · mlib · mpos · mneg |
| Outcome family | gaussian · beta (logit link, for a bounded 0–1 scale) |
| Predictor | unemployment · GDP growth |
| Predictor form | raw · log (unemployment only – growth goes negative) |
| Copredictor | none · the other macro measure |
| Estimator | two-way FE · country FE · random effects · pooled OLS |
| Sample | all · 2004–2008 · 2009–2013 · no bailout countries · no Greece and Spain |
| Weights | none · n_cell · n_eff · pop |
Eight of the fourteen axes. The other six – scoring rule, no-opinion handling, item set, cell weighting, published series and standard errors – are on the specification menu page, with copy-paste code for every option.
Two of these axes already varied in the red-card study, where the 29 teams split across four response distributions (outcome family) and four ways of handling non-independence (estimator).
What Task 2 of Multi100 left open
The three instructions fixed the outcome dimension, the predictor and the contextual controls. Everything else stayed open – including one thing that few people think of as a choice:
The unit of analysis. Two of the five fitted models on individual respondents; three worked on aggregates. Task 2 never said which, and the wording did not imply one.
Their five answers all obeyed the three instructions and still ran from r = −0.006 to r = −0.45, so the freedom that remained was enough to produce the whole spread.
The choices that move an estimate most are usually made before any model is fitted.
Ground rules for the menu
In Hands-on 4 the rule is: change one axis, hold the other thirteen at baseline.
Baseline = the specification you reproduced in Hands-on 3: mcosmo · gaussian · unemployment · raw · no copredictor · two-way FE · all years · unweighted · share of mentions · standard measurement settings · conventional SEs.
Changing one axis at a time keeps the class chart readable. Every dot differs from a common baseline on exactly one axis, so when a dot moves you can say what moved it.
And one convention binds everyone: claim-alignment. The negative framings are reverse-coded, 1 − y, so that supports the claim
reads as a negative sign whatever your outcome. Without it the class chart would straddle zero by construction and look like noise.
Hands-on 4 – Exploring the menu
Task 4 is exploratory. Try several specifications, look at what each one does, and get a feel for which axes move the estimate.
- Start from the baseline you reproduced
- Change one axis in
try_spec()and read what happens to b, t and the partial r;my_experiments()lists every try - Do it again with a different axis. Three or four is plenty
- Then rerun the one you can argue for best with
try_spec(), so that it is your last try, and submit it withsubmit_exploration()
Your dot appears on the live Multiverse page within seconds, and we read the dots from the whole class once everyone has submitted.
This is not your preregistered analysis. You are allowed to look, change your mind and try again, which is why this phase has a name of its own.
Your own small multiverse
You ran three or four specifications, all defensible, and watched the estimate move.
Nothing about that is unusual. Every analysis you have ever published came from a space like that – you reported one point from it.
The multiverse idea is the proposal that the space is itself a finding, and that showing one point without it is a form of incomplete reporting.
The class multiverse
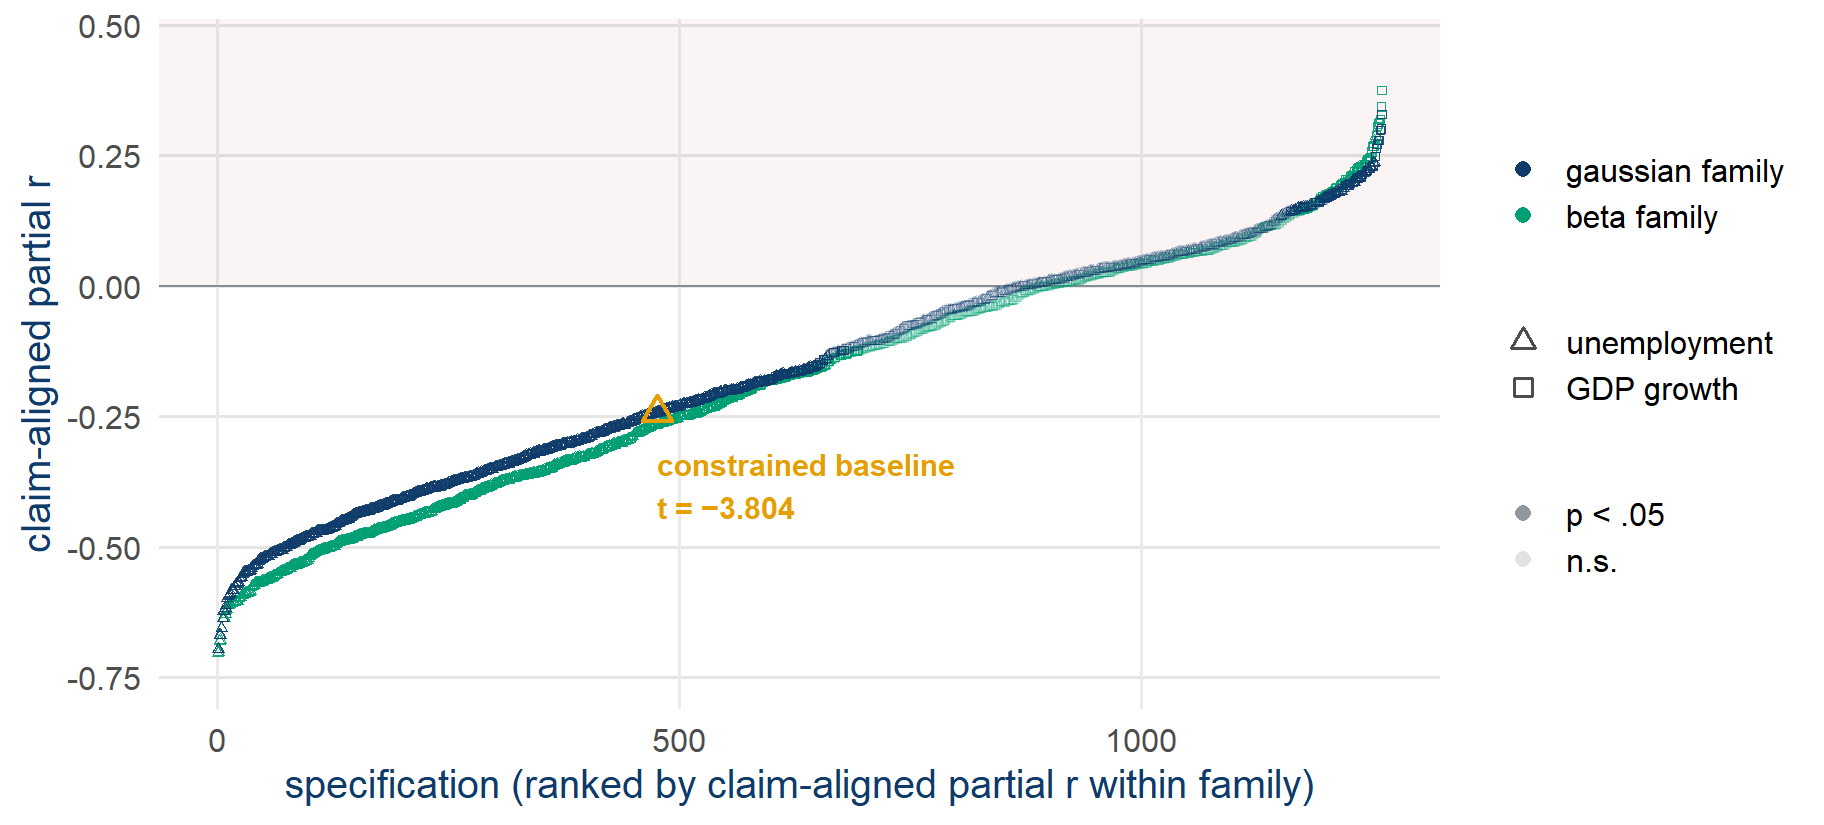
- The universe of 2,520 specifications: the Multi100 grid of 840 (blue unemployment triangles) plus the outcome-family and predictor axes, all at the standard measurement settings
- The grid of 840: 68.7% claim-consistent direction · 63.9% significant · claim-aligned partial r from −0.70 to +0.24
Pre-computed over the specification menu (data/spec_grid_full.csv), claim-aligned – negative framings reverse-coded and growth predictors sign-flipped, the convention that the preregistration block in Task 5 records (claim_align = TRUE).
The published results on the curve
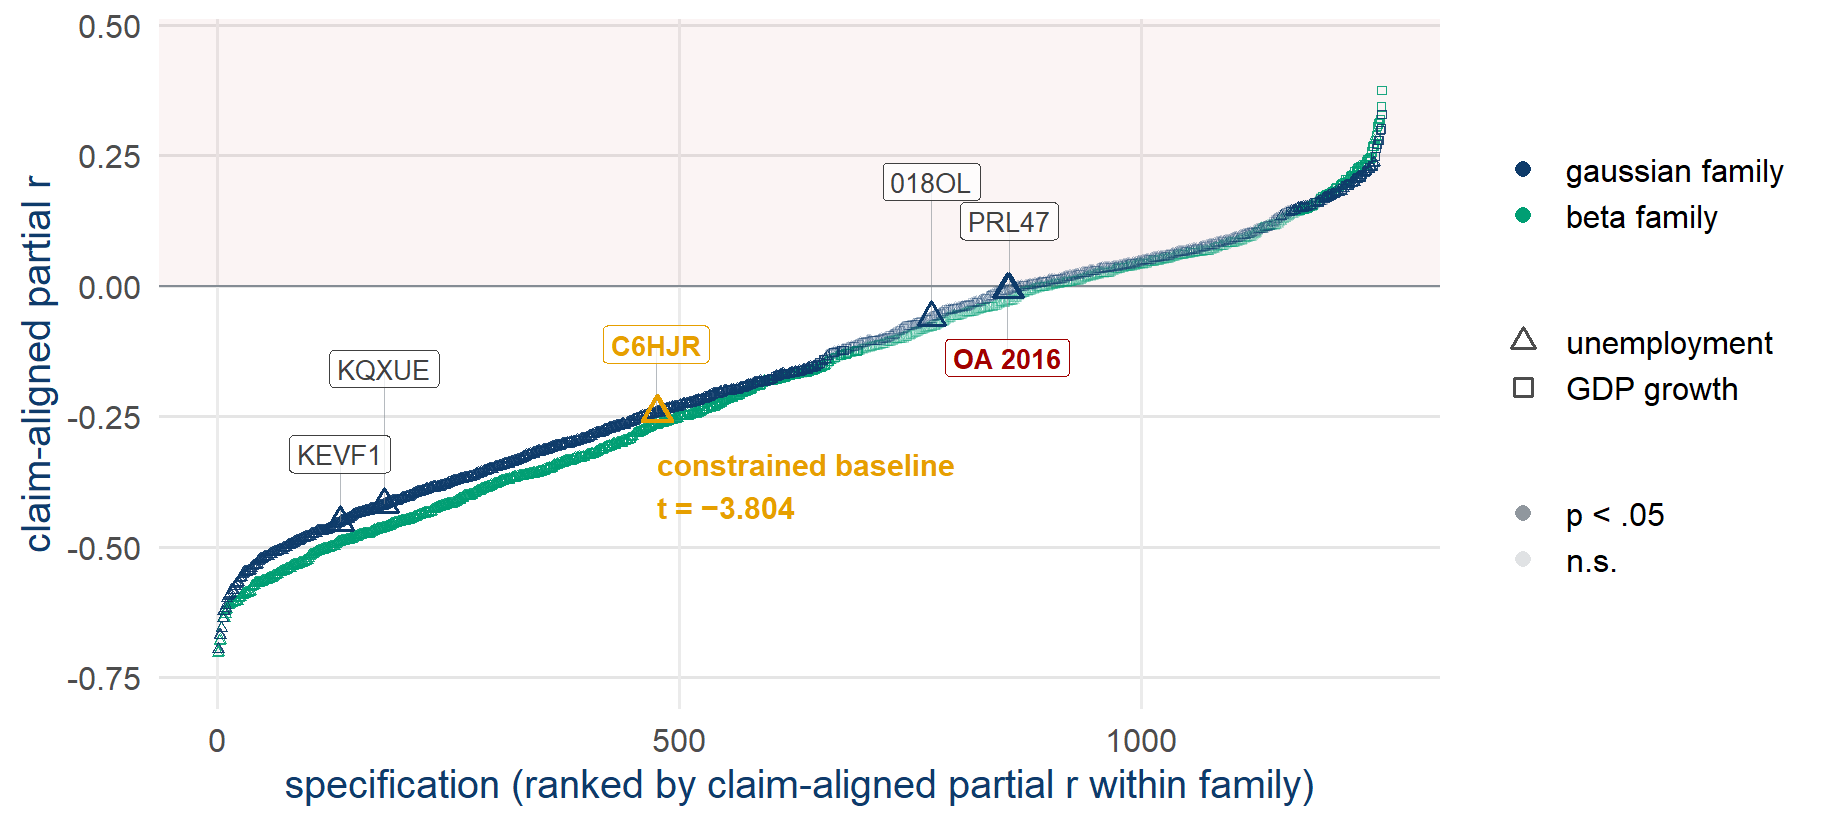
Your own dots are on the live Multiverse page, drawn on this same chart
submit_exploration() in Task 4 and report_result() in Task 5 each give you a one-click link to the Google Form; results appear on the Multiverse page.
Critics of the multiverse
Robustness is better assessed with a few thoughtful models than with billions of regressions
(Auspurg 2025; answering Ganslmeier and Vlandas 2025) – only justified models targeting the same estimand belong in one curve. Our grid is a curated 840, and a decomposition by fork does the job that every critic endorses: it locates where the argument must happenThere is only one correct analysis
once the question is fully specified (Lakens et al. 2026) – your preregistered specification guards against cherry-picking, and their deeper point is that preregistering a choice does not yet make it justified, which is what the estimand and DAG work were forWhat’s a multiverse good for anyway?
– reflection, persuasion, or inference, and each purpose needs a differently built universe (Rohrer et al. 2026). Ours was built for reflection, and how much more to read into it is the open debate
The one-correct-analysis argument
The argument from Lakens and colleagues runs in four steps:
- A research question, fully specified, implies a quantity to be estimated
- That quantity, together with the design and the assumptions you are willing to make, implies one analysis that estimates it
- So a spread of results is not evidence of legitimate diversity. It is evidence that most of those specifications are wrong – they estimate something else
- On this reading, showing a wide curve is closer to an admission than to a robustness check
Take it back to the red cards. Twenty-nine teams modelled one count of red cards as linear, logistic or Poisson. Those are claims about how the outcome was generated, and they cannot all be right – so on this argument most of the spread is error.
Lakens et al. (2026)
Identifying the one correct analysis
Grant the argument, and suppose that one correct analysis exists. Which one is it?
Getting there needs the estimand and the identification assumptions and agreement about the measurement – and on this claim, reasonable people disagree about all three.
So the curve complements the one-correct-analysis view: it is a map of the disagreement that remains, drawn because we cannot yet settle it.
And it points at what to argue about: on this claim, at the outcome, not at the estimator.
What preregistration settles
It does settle
- That your specification was not chosen because of the result
- That your rule for what counts as support was fixed before you had a result
- That a reader can see what you intended, and what you changed
It does not settle
- Whether the specification was any good
- Whether it estimates the quantity that your question implies
- Whether the assumptions behind it hold
A badly reasoned analysis that is preregistered is still badly reasoned; the preregistration only adds a timestamp
That is why the estimand and the DAG came first today: preregistration protects a choice, and the causal reasoning is what justifies it.
Exploration and preregistration
- Aim 2: assess the robustness of the constrained result
In Task 4 you explored: several specifications, tried in order to find out what they do. That was the right way to learn them
In Task 5 you preregister one specification: it goes into the preregistration block of your report before it runs, with a reason that your DAG supports
The code is identical. The difference is that one of these can be chosen because of its result and the other cannot
Archiving and registering a reanalysis
OSF, the Open Science Framework: a public repository in which data, code and registrations are timestamped and citable.
A registration is a frozen, dated snapshot of a plan. Anyone can check what you said you would do, and when.
You need no account today. We are going to read OSF the way that reviewers do.
Three OSF addresses
osf.io/8rtwe – the archival Multi100 record: analyst C6HJR, frozen as submitted
osf.io/6zqct – the maintained fork: the script, the codebook, the course data
osf.io/h7432 – the full SCORE dossier on the EU-frames case: all the reports and their verdicts
The SCORE dossier
- Find the secondary-data replication of the claim – new Eurobarometer data, N = 352,114
- Read its unemployment coefficient: the sign, the p-value
- Paste the b in chat when you have it (3 minutes)
The Multi100 preregistration
- Multi100: 100 claims × at least 5 independent analysts, no instructions on how to analyse
- The scoring rules – same conclusion? effect size close? – were fixed and public before any result came back
- Outcome: 74% same conclusion · 34% within ±0.05 d
Aczel et al. (2026). Project: osf.io/7snkz
Preregistration templates
- In your report: the AsPredicted short form, adapted for data you already hold – eight plain-language questions (on OSF:
Preregistration Template from AsPredicted.org
) - The fuller tool for our job: the secondary-data template (van den Akker et al. 2021, Meta-Psychology) – 26 items, built for reanalysing data you already hold
- Both templates are in your reading
The eight AsPredicted questions
| AsPredicted asks | Your block answers |
|---|---|
| Q1 Have data been collected? | It’s complicated – I already hold them+ what I already know |
| Q2 Main question / hypothesis? | the claim, in your one sentence |
| Q3 Dependent variable? | your outcome axis |
| Q4 Conditions? | your choices on the other twelve axes |
| Q5 Analyses? | your model + your support/undermine rule |
| Q6 Outliers / exclusions? | your sample axis |
| Q7 Sample size? | N = 270 country-years, fewer if your sample or series leaves some out |
| Q8 Anything else? | your DAG-grounded justification |
Hands-on 5 – The preregistration
- Open the preregistration block in your report
- Complete fields 1–5: the claim, the data-in-hand statement, your one specification, the one-sentence justification from your DAG, and your rule for what supports or undermines the claim
- Render, or on the browser lab page copy the completed cell into your notes
- Type
declared
in chat – then wait for the class
Nobody runs a model until everyone in the class has completed their preregistration block.
Hands-on 5 – The preregistered run
- Task 5 – run the specification in your preregistration, and only that one
report_result()prints a one-click link to the Google Form with your results already in it – click, submit- Your dot joins the Multiverse page as a declared result (the chart’s name for a preregistered specification), beside the exploratory ones from Task 4
Compare the two waves. If the preregistered dots fall systematically to one side of the exploratory ones, it is worth discussing why.
Stuck? Chat STUCK
· reload and rerun · second browser · follow my screen · last resort: the grid lookup on the menu page gives you the results for your specification by hand
Two points from the literature
the common single-path analyses in social and behavioural research should not be simply assumed to be robust to alternative analyses
(Aczel et al. 2026)
A blueprint: precise question → causal reasoning (DAG) → multiverse → sensitivity analysis (Auspurg and Brüderl 2021)
- Same-conclusion robustness and same-number robustness are different bars
- Justifiability is the criterion – choose with reasons, show the spread
The single analytical path
There is no privileged single analytical path – only justifiable ones, explored openly.
You made one justifiable choice today, preregistered it with its reason before running it, and placed it inside a multiverse.
codemoreh.github.io/applied-replication
Everything is open, and you can fork any of it.
What you take with you
- Yours now: a rendered report with its preregistration block · an estimand statement and a causal graph that you wrote yourself · two dots on the class chart, one exploratory from Task 4 and one preregistered from Task 5
- Read: the three Nature 2026 papers (Miske et al. 2026; Aczel et al. 2026; Tyner et al. 2026) · the glossary (Nosek et al. 2025) · Auspurg and Brüderl (2021) · Lundberg et al. (2021) · Lakens et al. (2026) · Teney (2016)
- Explore: the sixteen companion modules (among them intro to R · Quarto documents · the statistics behind today · causal graphs · the multiverse debate · simulation · the individual level · repositories & preregistration · git & GitHub) · the Multi100 data ·
fixest&ggdagdocs - Keep going locally: the research-software and open-research teams at your university · a ReproducibiliTea journal club near you
- Everything is on the course site, and everything is open – fork any of it
References
Aczel, Balazs, Barnabas Szaszi, Harry T. Clelland, et al. 2026. “Investigating the Analytical Robustness of the Social and Behavioural Sciences.” Nature 652 (8108): 135–42. https://doi.org/10.1038/s41586-025-09844-9.
Alipourfard, Nazanin, Beatrix Arendt, Daniel M Benjamin, et al. 2021. Systematizing Confidence in Open Research and Evidence (SCORE). 46mnb_v1. SocArXiv. https://doi.org/10.31235/osf.io/46mnb.
Auspurg, Katrin. 2025. “Robustness Is Better Assessed with a Few Thoughtful Models Than with Billions of Regressions.” Proceedings of the National Academy of Sciences 122 (43): e2521917122. https://doi.org/10.1073/pnas.2521917122.
Auspurg, Katrin, and Josef Brüderl. 2021. “Has the Credibility of the Social Sciences Been Credibly Destroyed? Reanalyzing the ‘Many Analysts, One Data Set’ Project.” Socius 7 (January): 23780231211024421. https://doi.org/10.1177/23780231211024421.
Breznau, Nate, Eike Mark Rinke, Alexander Wuttke, et al. 2022. “Observing Many Researchers Using the Same Data and Hypothesis Reveals a Hidden Universe of Uncertainty.” Proceedings of the National Academy of Sciences 119 (44): e2203150119. https://doi.org/10.1073/pnas.2203150119.
Cole, Stephen R., Robert W. Platt, Enrique F. Schisterman, et al. 2010. “Illustrating Bias Due to Conditioning on a Collider.” International Journal of Epidemiology 39 (2): 417–20. https://doi.org/10.1093/ije/dyp334.
D’Agostino McGowan, Lucy, Travis Gerke, and Malcolm Barrett. 2024. “Causal Inference Is Not Just a Statistics Problem.” Journal of Statistics and Data Science Education 32 (2): 150–55. https://doi.org/10.1080/26939169.2023.2276446.
Ganslmeier, Michael, and Tim Vlandas. 2025. “Estimating the Extent and Sources of Model Uncertainty in Political Science.” Proceedings of the National Academy of Sciences 122 (25): e2414926122. https://doi.org/10.1073/pnas.2414926122.
Gelman, Andrew, and Eric Loken. 2014. “The Statistical Crisis in Science.” American Scientist 102 (6): 460–66. https://doi.org/10.1511/2014.111.460.
Griffith, Gareth J., Tim T. Morris, Matthew J. Tudball, et al. 2020. “Collider Bias Undermines Our Understanding of COVID-19 Disease Risk and Severity.” Nature Communications 11 (1): 5749. https://doi.org/10.1038/s41467-020-19478-2.
Hernán, Miguel A., and James M. Robins. 2020. Causal Inference: What If. Chapman & Hall/CRC.
Huntington-Klein, Nick. 2021. The Effect: An Introduction to Research Design and Causality. Chapman & Hall/CRC. https://theeffectbook.net/.
Ioannidis, John P. A. 2005. “Why Most Published Research Findings Are False.” PLoS Medicine 2 (8): e124. https://doi.org/10.1371/journal.pmed.0020124.
John, Leslie K., George Loewenstein, and Drazen Prelec. 2012. “Measuring the Prevalence of Questionable Research Practices with Incentives for Truth Telling.” Psychological Science 23 (5): 524–32. https://doi.org/10.1177/0956797611430953.
Keele, Luke, Randolph T. Stevenson, and Felix Elwert. 2020. “The Causal Interpretation of Estimated Associations in Regression Models.” Political Science Research and Methods 8 (1): 1–13. https://doi.org/10.1017/psrm.2019.31.
Lakens, Daniel, Sajedeh Rasti, and Mehmet N. Tunç. 2026. There Is Only One Correct Analysis. PsyArXiv. https://osf.io/preprints/psyarxiv/hvjxf_v1/.
Leszczensky, Lars, and Tobias Wolbring. 2022. “How to Deal with Reverse Causality Using Panel Data? Recommendations for Researchers Based on a Simulation Study.” Sociological Methods & Research 51 (2): 837–65. https://doi.org/10.1177/0049124119882473.
Lundberg, Ian, Rebecca Johnson, and Brandon M. Stewart. 2021. “What Is Your Estimand? Defining the Target Quantity Connects Statistical Evidence to Theory.” American Sociological Review 86 (3): 532–65. https://doi.org/10.1177/00031224211004187.
Miske, Olivia, Anna Lou Abatayo, Mason Daley, et al. 2026. “Investigating the Reproducibility of the Social and Behavioural Sciences.” Nature 652 (8108): 126–34. https://doi.org/10.1038/s41586-026-10203-5.
Munafò, Marcus R., Brian A. Nosek, Dorothy V. M. Bishop, et al. 2017. “A Manifesto for Reproducible Science.” Nature Human Behaviour 1 (1): 0021. https://doi.org/10.1038/s41562-016-0021.
Nosek, Brian A, Timothy M Errington, Noah Haber, Theresa Stankov, and Andrew H Tyner. 2025. A Brief Glossary of Terms about Repeatability: Replicability, Robustness, and Reproducibility. mqfp4_v1. MetaArXiv. https://doi.org/10.31222/osf.io/mqfp4_v1.
Open Science Collaboration. 2015. “Estimating the Reproducibility of Psychological Science.” Science 349 (6251): aac4716. https://doi.org/10.1126/science.aac4716.
Rohrer, Julia M., Jessica Hullman, and Andrew Gelman. 2026. What’s a Multiverse Good for Anyway? PsyArXiv. https://osf.io/preprints/psyarxiv/37g29_v1/.
Sánchez-Tójar, Alfredo, Jelte M. Wicherts, and Robb Willer. 2026. “Huge Meta-Research Project Puts Claims in Social-Science Papers to the Test.” Nature 652 (8108): 39–41. https://doi.org/10.1038/d41586-026-00805-4.
Silberzahn, R., E. L. Uhlmann, D. P. Martin, et al. 2018. “Many Analysts, One Data Set: Making Transparent How Variations in Analytic Choices Affect Results.” Advances in Methods and Practices in Psychological Science 1 (3): 337–56. https://doi.org/10.1177/2515245917747646.
Simmons, Joseph P., Leif D. Nelson, and Uri Simonsohn. 2011. “False-Positive Psychology: Undisclosed Flexibility in Data Collection and Analysis Allows Presenting Anything as Significant.” Psychological Science 22 (11): 1359–66. https://doi.org/10.1177/0956797611417632.
Teney, Céline. 2016. “Does the EU Economic Crisis Undermine Subjective Europeanization? Assessing the Dynamics of Citizens’ EU Framing Between 2004 and 2013.” European Sociological Review 32 (5): 619–33. https://doi.org/10.1093/esr/jcw008.
Tyner, Andrew H., Anna Lou Abatayo, Mason Daley, et al. 2026. “Investigating the Replicability of the Social and Behavioural Sciences.” Nature 652 (8108): 143–50. https://doi.org/10.1038/s41586-025-10078-y.
Young, Cristobal, and Erin Cumberworth. 2025. Multiverse Analysis: Computational Methods for Robust Results. Analytical Methods for Social Research. Cambridge University Press. https://doi.org/10.1017/9781009003391.
Feedback
Feedback form
(link in the chat · two minutes)