

Applied replication for data skills
One day – an introduction to the statistical methods
Chris Moreh
Applied replication for data skills · a CodeMoreh workshop
A full-day workshop · four parts · the methods in the foreground
- The case and the vocabulary – the credibility debate, what
replication
names, and the five analysts - The claim and its estimand – the paper in full, estimands, causal graphs and fixed effects
- Reproduction and the specification menu – the axes that set the question and the model, and what each one does to an estimate
- Multiverse and preregistration – the specification curve, what it establishes, and the preregistered analysis
You leave with: a reproduced result · an estimand and a DAG of your own · a working knowledge of every estimator on the menu · a preregistered analysis and your dot on the class chart
Work along in your IDE, solo or in pairs, with the browser lab page as the fallback
Two kinds of aim
What I want you to understand
- Why
replication
names three operations, and what each one tests - What an estimand is, and why analysts who disagree are often answering different questions
- What a causal graph commits you to, and what two-way fixed effects adjust for
- What each axis of a specification – outcome, family, predictor, estimator, sample, weights – does to an estimate
- What a specification curve establishes, why hundreds of estimates are not hundreds of tests, and what preregistration settles
What I want you to be able to do
- Reproduce a published result to the third decimal
- Write an estimand in one sentence, and a graph whose adjustment set you derived
- Fit the same claim under pooled, fixed-effects and random-effects estimators and read each output
- Vary one axis at a time and say what changed and why
- Preregister one analysis before you run it, and place it among the alternatives
What you do not need
- No git, and no GitHub account
- No OSF account – we will read OSF, not log into it
- No working installation yet: the browser lab runs R inside the web page, and Task 1 sets yours up
- Nothing to sign up for; nothing leaves your machine except the results you choose to submit
Do this now: open your workspace folder in your IDE, and open the browser lab in a tab beside it; R loads in the page while we talk.
PART 1 – The case and the vocabulary
Part 1 · 90 minutes
What social science is for
Making claims about the world that could turn out to be wrong – and saying how we would know.
A claim is offered to others so that they can check it, use it, argue with it, build on it.
Science depends on that handover, and everything that follows is about whether it works.
False positives and forking paths
- The theory, 2005. With small studies, small true effects, flexible designs and many teams chasing the same question, most published findings in a field can be false with nobody breaking any rules (Ioannidis 2005)
- The demonstration, 2011. Give researchers only the flexibility they legitimately have – which cases to drop, which covariates to keep, when to stop collecting – and a false-positive rate of 5% becomes over 60% (Simmons et al. 2011)
- The subtlety, 2014. You do not need many tests. In a garden of forking paths, a single test chosen after looking at the data already has the wrong p-value (Gelman and Loken 2014)
Evidence from replications and many-analysts studies
- 100 psychology studies, replicated with high power and the original materials: 97% of the originals were significant, 36% of the replications were, and effect sizes roughly halved (Open Science Collaboration 2015)
- 161 researchers, 73 teams, one hypothesis on immigration and support for social policy: 1,253 models, and no convergence on either sign or significance (Breznau et al. 2022)
Different fields and different designs. In the first, most findings were not significant again in new samples; in the second, the result depended on who ran the analysis.
Incentives and questionable research practices
Fraud exists, but it is rare. The mechanism behind these results is ordinary and structural:
- Journals reward novel, clean, significant results – so that is what gets written up
- Every analysis contains dozens of small defensible choices, and the analyst makes them while looking at the data
- Nobody publishes the twelve specifications that did not work; the reader sees one
- Data and code are usually not available, so nobody can check any of it
Ask researchers anonymously, with an incentive to answer truthfully, and a majority admit to at least one of these ordinary practices (John et al. 2012)
None of these steps requires a dishonest person, so the problem cannot be fixed by hiring better people.
The red-card study
The question. Are football referees more likely to give red cards to dark-skinned players than to light-skinned ones?
The data. One dataset, sent to everyone: 2,053 players in the top divisions of England, Germany, France and Spain, the 3,147 referees they played under, and 146,028 player–referee pairs. Skin tone rated from profile photographs by two coders who did not know the research question.
The design. Twenty-nine teams analysed it independently. They reviewed each other’s approaches before anyone had seen a result, revised, and only then compared answers.
This is the first many-analysts study. Every one since is a variation on it, including the one that this course works on.
Silberzahn et al. (2018)
The twenty-nine estimates
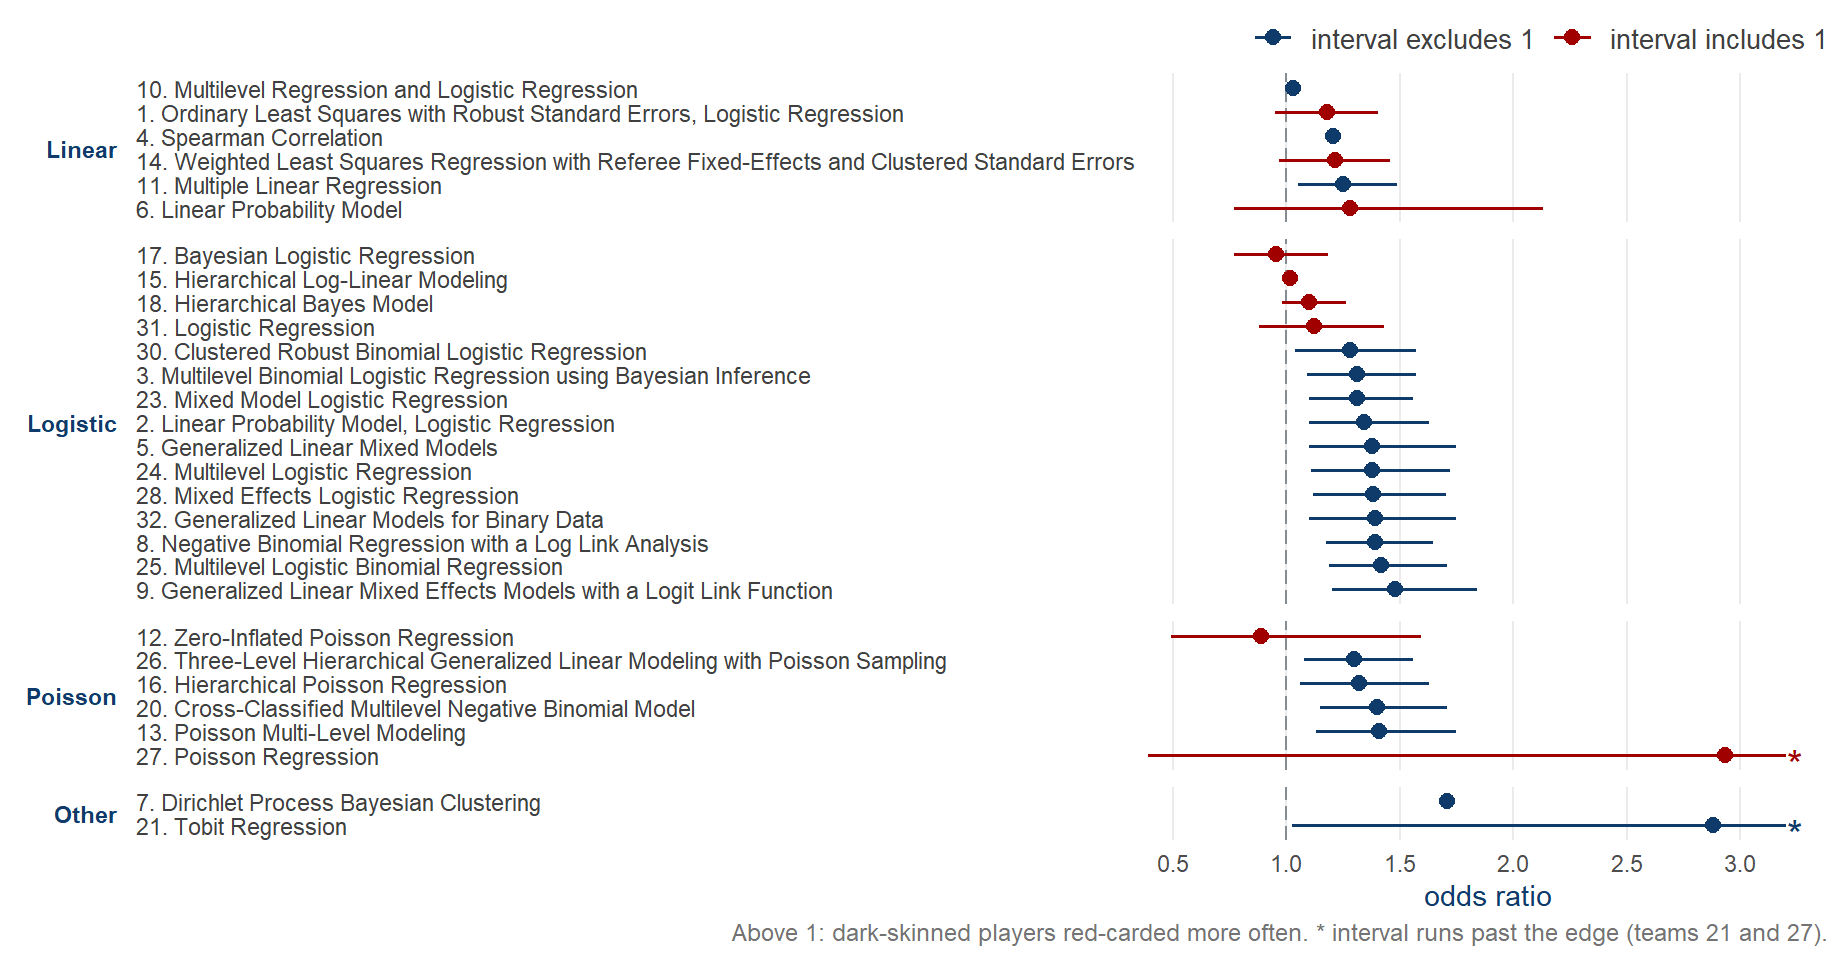
Silberzahn et al. (2018), Figure 3, rebuilt from the published values at osf.io/gvm2z.
Replication
crises
Another replication
crisis – terminological confusion?
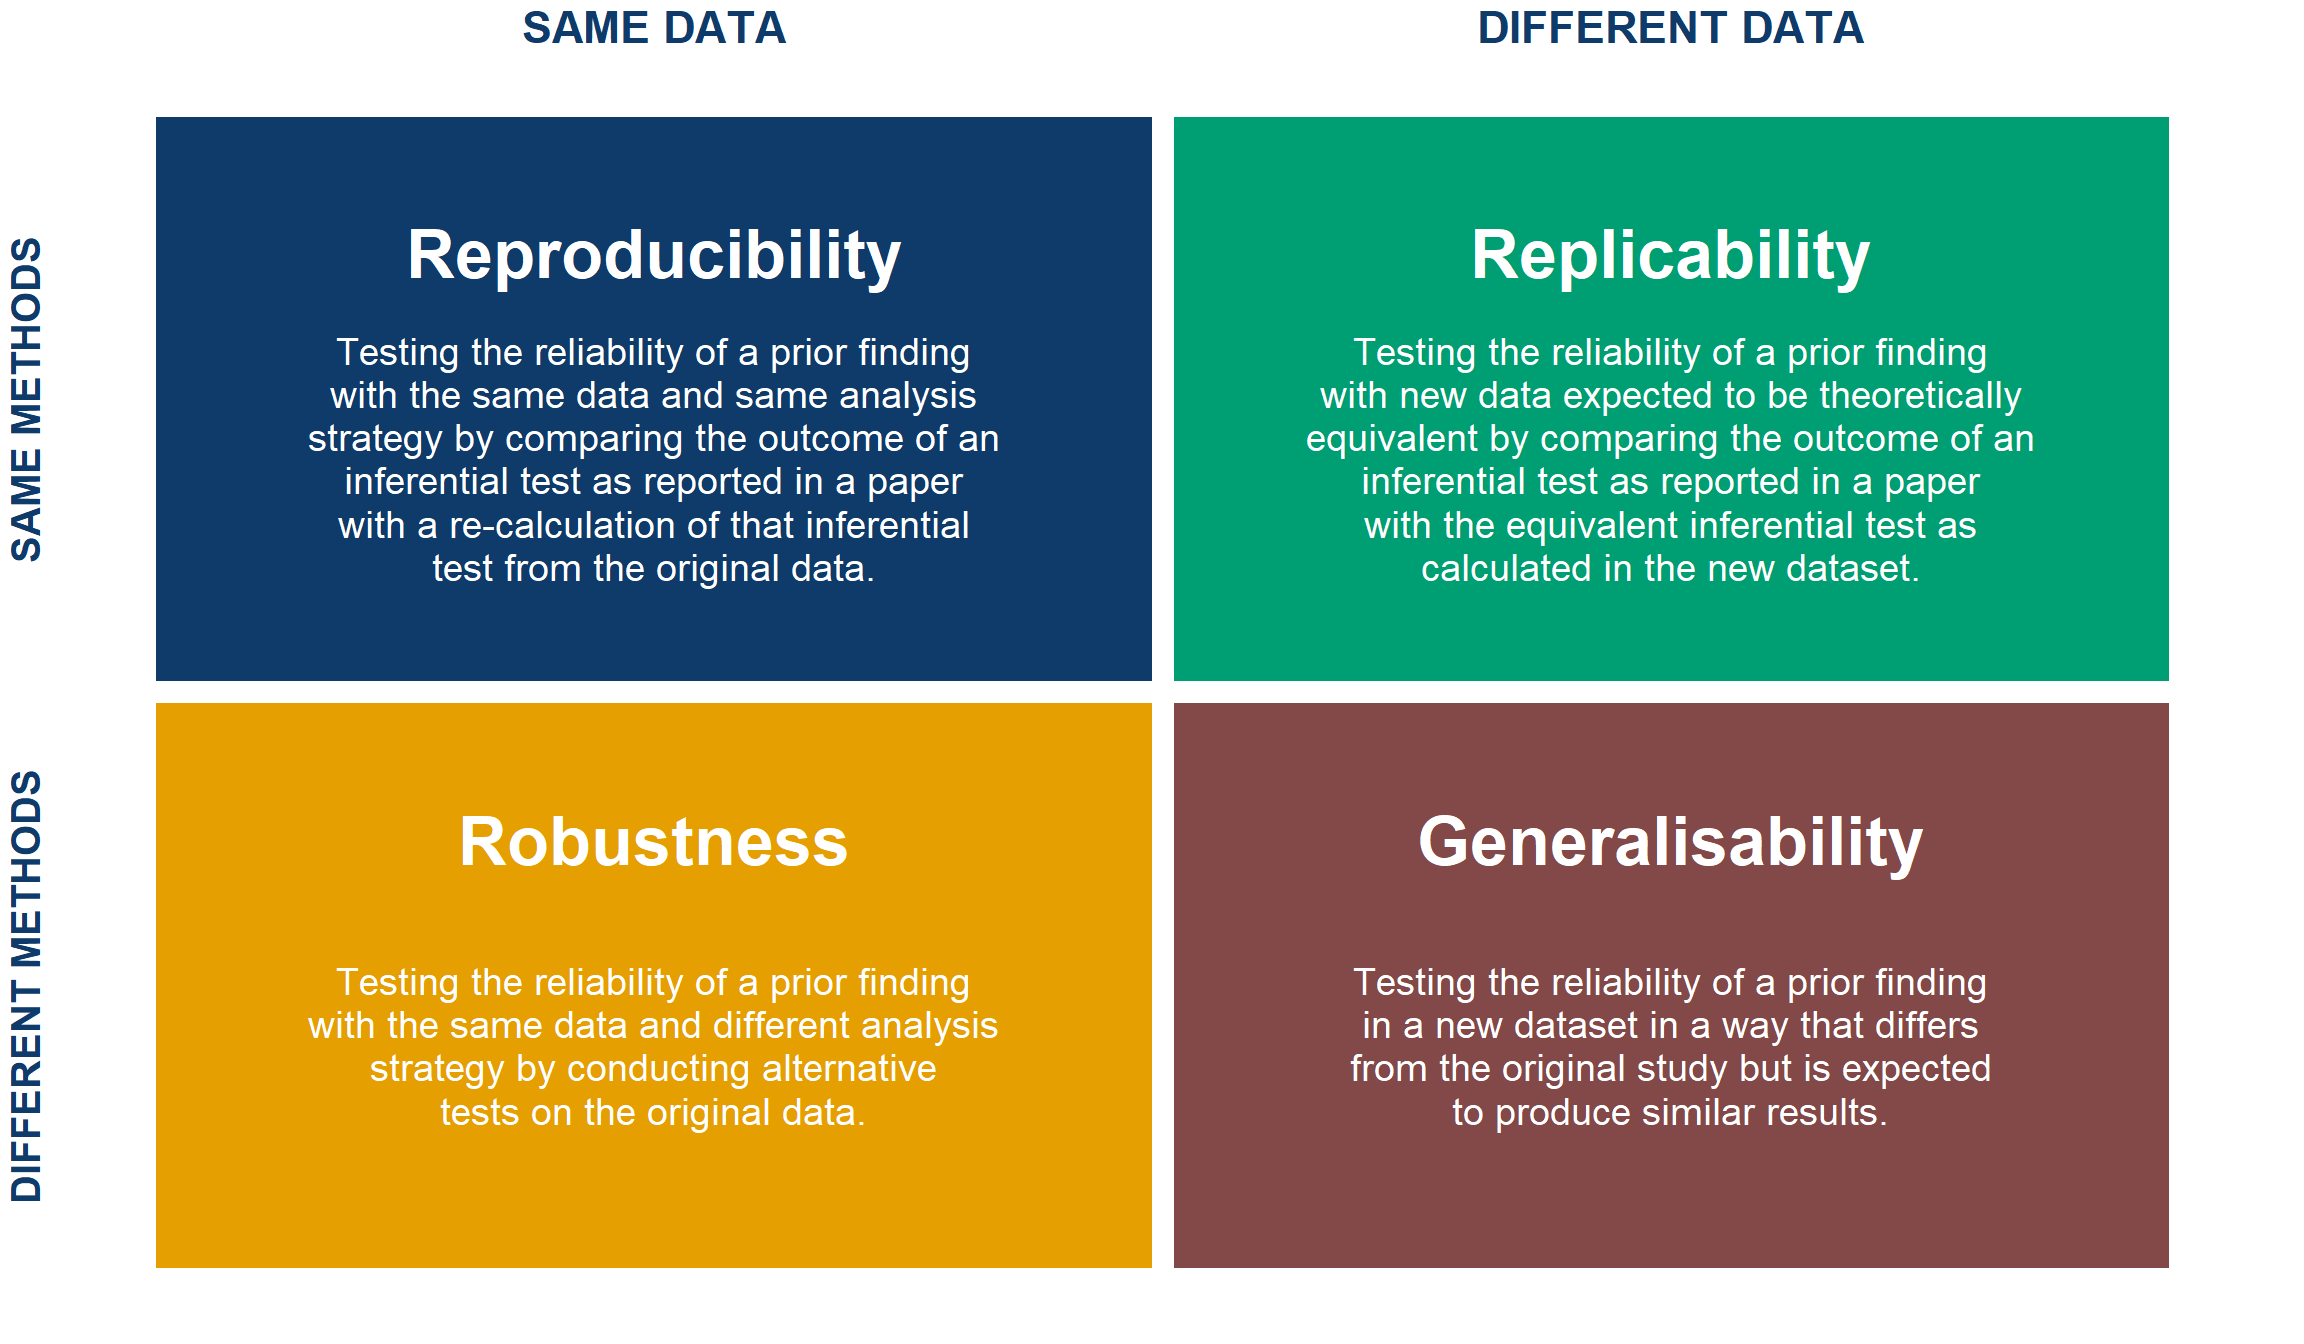
The term reproducibility
has been used as a synonym for a number of different characteristics – reproducibility, robustness, replicability, repeatability, credibility, and trustworthiness (Nosek et al. 2025, 2).
Successfully rerun the same code on the same data? Re-analyse the same data a different way? Collect fresh data and analyse it in the same way? Using the same data and same analysis but asking a different question? Asking the same question but answering it with fresh data and a different analysis?
The data \(\times\) analysis matrix
Repeatability and credibility
Repeatability is used when referring to reproducibility, robustness, and replicability as a constellation of concepts intended to assess whether answers to scientific questions are unchanged when different steps of the research process are repeated.
Credibility and trustworthiness refer to the confidence one can have in research findings. Because scientific knowledge claims are tentative, they are not synonymous with truth.
For example, credibility is advanced by addressing potential competing interests in the conducting and reporting of research, by taking existing knowledge into account, by using methods that have been validated, by controlling for biases in the research context, by pursuing precise and reliable evidence, and by calibrating the strength of the claims to the uncertainty of the evidence.
Nosek et al. (2025, 2)
Quick check – the matrix in peer review
You submit your paper and replication package. It goes out to reviewers.
Reviewer 1
wants to ensure that your results are reproducible, so she sources your R script to run the entire analysis. You’re in luck – she hasn’t yet updated herdplyr, so the code runs.Reviewer 2
is very eager. He’s unconvinced by your modelling choices, so he fits your data to another function to check if your findings are truly robust. You’re in luck again – he recovers your point estimate to a reasonable precision, although the confidence intervals have widened.Reviewer 3
takes a special interest because he’s just working on a similar paper on data they published recently. Do your results replicate when your methods are applied to that state-of-the-art dataset?
Quick check – the matrix in peer review
You submit your paper and replication package. It goes out to reviewers.
Reviewer 2
just doesn’t want to let go…
- He tried a few alternative analyses of your data, including a fancy new regression method that he just released as an R package. His method gives results that are generally aligned to yours, but for the method to work, it would require a larger dataset; would your results really generalise to this new dataset published by
Reviewer 3
that he just read about, if applying his new fancy method to it?
Open research: the practices
| Practice | What it makes possible |
|---|---|
| Open data | Someone else can re-analyse your evidence |
| Open code | Someone else can rerun your exact analysis |
| Open materials | Someone else can run your study again |
| Open access | Someone else can read the claim in the first place |
| Preregistration | A dated record of the analysis plan, filed in a registry before the results exist |
| Registered reports | Peer review of the plan, with publication decided before results |
Each one removes a specific obstacle, and none of them guards against every problem. The programme, set out at length: (Munafò et al. 2017)
What a Multi100 analyst received
- A published paper, in full and not blinded, so I could see the original estimates
- Its central claim, in one sentence, lifted from the abstract
- A pointer to the data – in our case, sixteen Eurobarometer waves you fetch yourself from GESIS
- No instructions on method – any analysis you can defend
And two things I was not told: who the other analysts were, and what they were finding.
Aczel et al. (2026). Registered protocol: osf.io/7snkz
The paper in brief
- Author: I will say OA, the original author, from here on
- Does the EU economic crisis undermine support for the EU? – 16 Eurobarometer waves, 2004–2013, about 390,000 respondents in 27 countries
The results show, first, that poor economic performances increase negative and decrease positive dimensions of EU framing.
- Macro predictors: national unemployment and GDP growth. Outcome: what people say the EU means to them, sorted into four framing scales
Teney (2016). The full methodological reading comes later in the course.
The two Multi100 tasks
Task 1 – free reanalysis. Reanalyse the claim however you see fit. Record one categorical conclusion: does the evidence support it?
Task 2 – constrained reanalysis. Months later, three instructions arrive that fix the question:
- use the cosmopolitan framing dimension as the outcome
- use the unemployment rate as the predictor
- disregard the contextual variables
Task 1 measures whether we agree. Task 2 makes our numbers comparable – you cannot average five answers to five different questions.
Results on a common scale
- Every analyst reports their test statistic and its degrees of freedom, in whatever form their model produces – t, z, F, \(\chi^2\)
- Each is converted to a partial correlation r and a standardised Cohen’s d, so a pooled model fitted in Stata and a multilevel model fitted in R can be read on the same axis
- A peer panel judges whether each pipeline is an appropriate analysis of the claim
- Only then can you ask: how far apart are five defensible answers?
Standardising makes the comparison possible, but it assumes that the five are estimating the same quantity. Hold that thought until we come to estimands.
The five analysts – Task 2 results
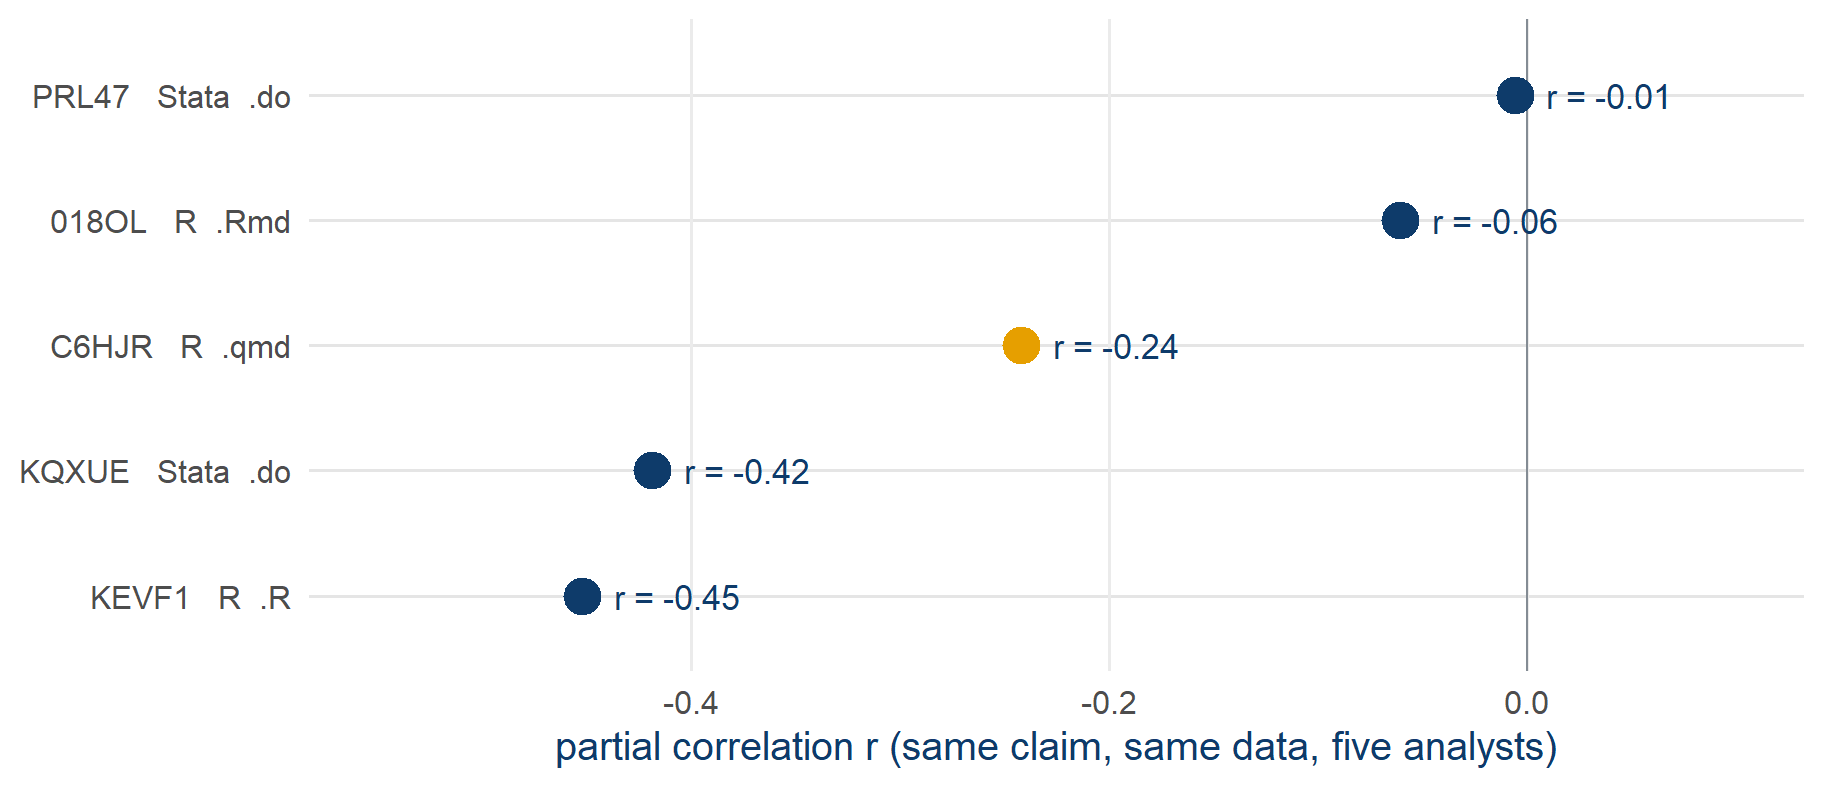
- All five estimates negative, with partial r from −0.45 to −0.006, and one of them not significant
Task 2 results as recorded in the public Multi100 dataset (osf.io/q5h2c).
Software and document formats
- Two of us worked in Stata, three in R
- Within R, three different document formats: a plain
.Rscript, an.Rmd, a.qmd
The software did not cause the spread. There is no Stata answer and no R answer to this claim.
But because each of us submitted a document that somebody else could open and run, it became possible, afterwards, to find out what did cause it.
That is what the toolchain is for.
The workspace and the browser lab
Your IDE and the workspace
- The workspace folder you downloaded, opened in your IDE (Positron, RStudio, VS Code, etc.)
- Quarto renders your report;
fixestfits your models - No git, no cloning, no configuration – it is just files
- This is what I drive on the shared screen
The browser lab
- One web page. R is compiled to run inside the browser
- Nothing installed, nothing to break, data already in place
- The same tasks, data and helpers, on the shared screen and in your own tab
- Your spare if your installation misbehaves at any point
github.com/CodeMoreh/replication-lab – download zip → unzip → open in your IDE
What the tools cannot do
A perfectly reproducible pipeline can be a perfectly reproducible answer to a question you never stated.
None of this software will tell you what your estimand is, whether your controls belong in the model, or whether the association you found means what you think it means.
Tooling is the cheap half of the problem, because it can be learned. The expensive half is the question that the analysis is meant to answer.
Hands-on 1 – The setup check
Task 1 – the setup check. Get to the point where a line of R runs and the data are in front of you.
- Workspace: your IDE opens the workspace folder, the packages install,
working_script.Rruns its first block, and the report skeleton renders - Browser lab: the page has finished loading, the first chunk runs, and
euframeshas 270 rows
Take the time you need, into the next break if necessary. Type a green circle in chat when you are through; type STUCK and I will come to you.
If your installation will not cooperate, do not fight it – open the browser lab and carry on. Nothing in the tasks depends on which one you use.
Break
30 minutes – the return time is in the chat · keep setting up if you need to
PART 2 – The claim and its estimand
Part 2 · 90 minutes
The original paper
- 16 Eurobarometer waves, 2004–2013; about 390,000 respondents in 27 countries
The results show, first, that poor economic performances increase negative and decrease positive dimensions of EU framing.
What does the EU mean to you personally?
- COSMOPOLITAN: positive non-materialist form of EU framing (
Peace
;Democracy
;Freedom to travel, study and work anywhere in the EU
;Cultural diversity
;Stronger say in the world
) - UTILITARIAN: positive materialist form of EU framing (economic prosperity and social protection)
- COMMUNITARIAN: negative non-materialist form of EU framing (
Loss of our cultural identity
;More crime
;Not enough control at external borders
;Unemployment
) - LIBERTARIAN: negative materialist form of EU framing (
Bureaucracy
;Waste of money
)
- COSMOPOLITAN: positive non-materialist form of EU framing (
Teney (2016).
The claim card, as analysts received it
… poor economic performances … decrease positive dimensions of EU framing
Teney (2016: 619)
- Published coefficient – unemployment → cosmopolitan framing, Table 3 Model 1:
- b = −0.00340 · t = −4.03 · p < .001
The model OA fitted
- The unit is a person, not a country-year: roughly 390,000 respondents
- Thirteen response options collapse into four framing scales – cosmopolitan, utilitarian, communitarian, libertarian
- A three-level model: respondents inside country-waves inside countries
- Individual covariates: sex · age · education band · occupational status · urbanisation · left–right placement
- Macro predictors: unemployment rate and GDP growth, entering at the country-wave level
- Plus cross-level interactions – does the macro effect differ by education?
Published coefficient, Table 3 Model 1 – unemployment on cosmopolitan framing: b = −0.00340 · t = −4.03 · p < .001
Teney (2016).
Model 1 and Model 2
- Model 1: unemployment → cosmopolitan framing · b = −0.00340 · t = −4.03 · p < .001
- Model 2: the same coefficient, with further controls added – drops by more than half and loses significance
Within one paper, support for the claim depends on which of the two models you read. The paper reports both, which is more than many do.
That matters for the tasks, because the sixth analyst’s problem – which defensible specification do I report? – was already live inside the original study, before any of us arrived.
OA’s data and the course panel
OA’s data
- ~390,000 respondents
- 16 waves, 27 countries
- GESIS-licensed: I may not redistribute it
- Models take minutes
The course panel – EUframes_cy.csv
- 270 country-years, one row each
- The framing scales, averaged within each country-year
- Freely shareable, ships with the workspace and the browser lab
- Models take milliseconds
The aggregate panel addresses the contextual question directly: does a country’s framing move when its unemployment moves? It cannot address the compositional one, which asks whether the same people are framing differently or the mix of people has changed. There is a companion module that takes that up on simulated individual data.
Attempts to reproduce the paper
- Data: openly available but not freely redistributable
The required data to replicate my analyses can be downloaded on the Gesis repository website. I am not allowed to forward the Eurobarometer data. Enclosed you´ll find the code to combine the different Eurobarometer data waves and the code for the analysis of the ESR piece
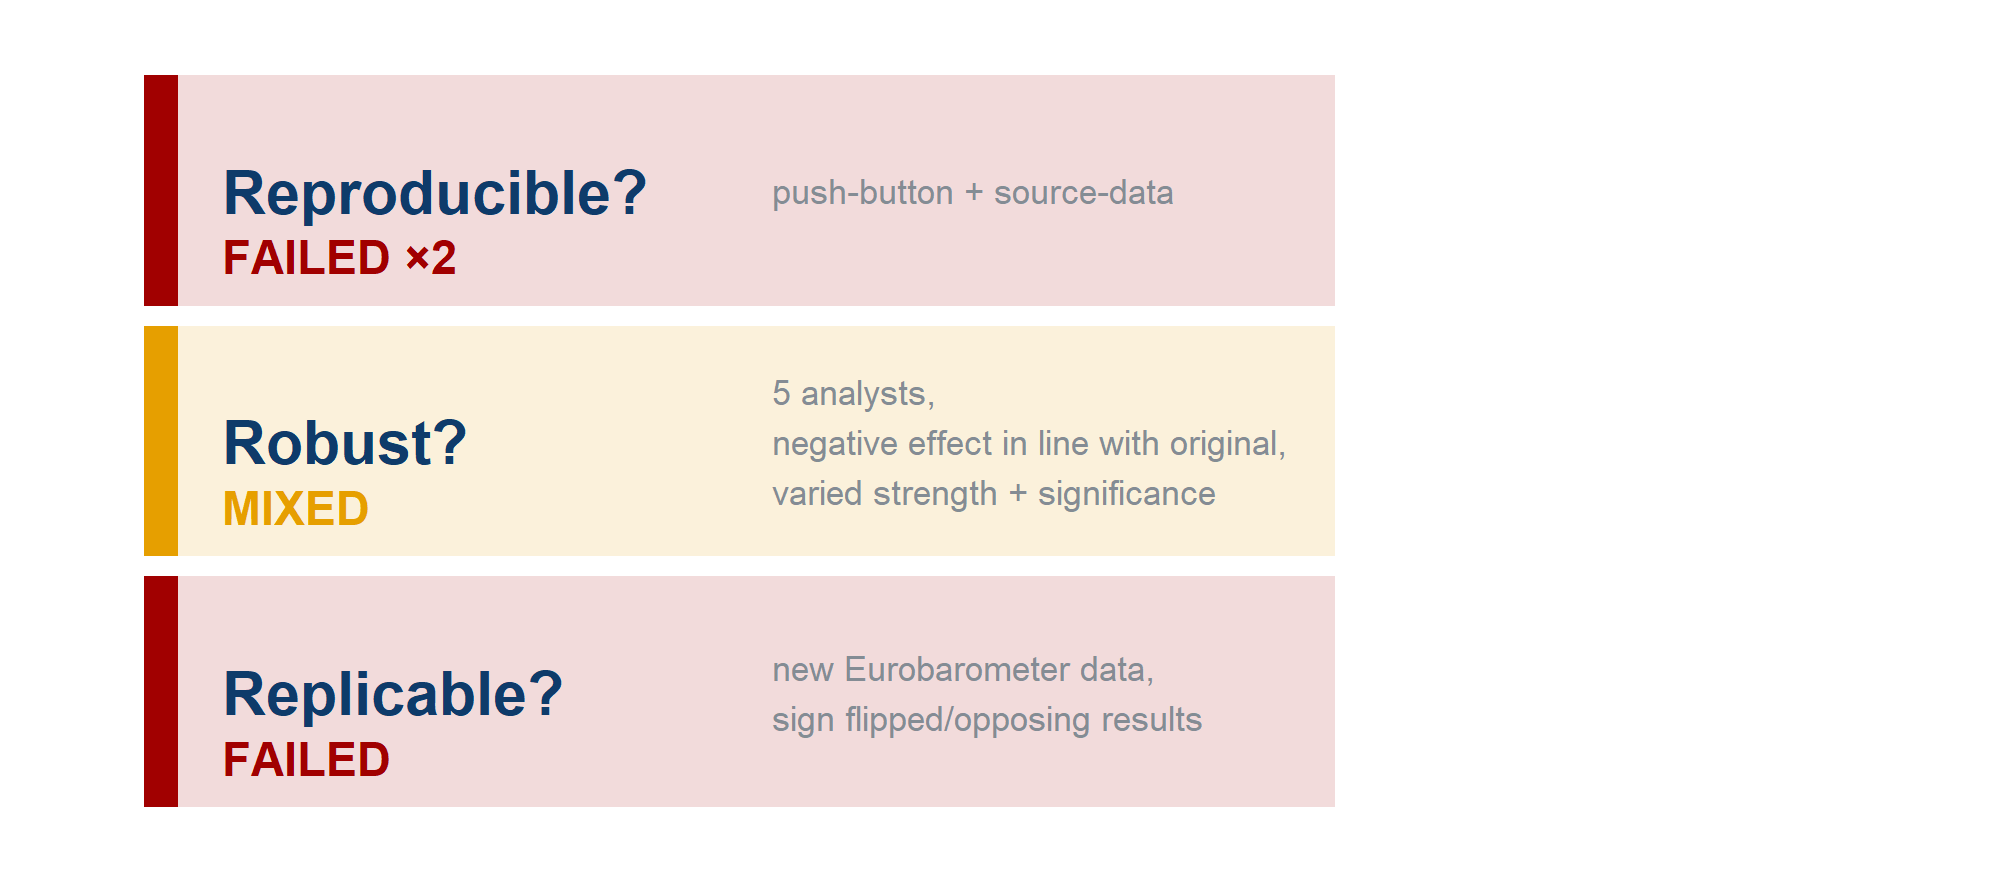
- Code: push-button reproduction failed
The reproduction attempt failed because the authors used file names that did not correspond with the names of the files available for download. Additionally 16 datasets are listed on the website as being used but the code references 18 files
- Source-data reproduction (rebuild from raw) –
not reproduced
: could neither extract nor re-calculate the original effect size
Replication on new data
Analysis One – the focal test on which SCORE evaluates the claim
- 352,114 person-year observations in the analytic sample
- b = 0.002, p = 0.046, se = 0.0008, t = 2.004
Analysis Two – the
still studying
andno full-time education
categories in the variableage when finished full-time education
were not converted to missing values- 379,396 person-year observations in the analytic sample
- b = 0.002, p = 0.017, se = 0.0007, t = 2.394
Both give a positive coefficient for unemployment on cosmopolitan framing, significant at p-values of 0.05 or less, after controlling for selected predictors and for wave and country-level effects
By the criteria used by SCORE, Analysis Two did not replicate the claim
The three Rs on this paper
The five free-phase analyses
| Analyst | Free-phase predictor | Free-phase outcome | Estimator |
|---|---|---|---|
| 018OL | GDP per capita (level) | positive framing, 7-item mean | crossed random intercepts |
| KEVF1 | GDP growth | positive framing, 7-item sum | random intercepts |
| PRL47 | log GDP + growth + crisis dummy | three positive-framing shares | three-level mixed |
| KQXUE | GDP growth and unemployment | cosmopolitan + utilitarian shares | country FE |
| C6HJR | GDP growth and unemployment | positive framing, 7-item share | two-way FE |
- Five free analyses, five different questions – three of us never touched unemployment at all – and one shared recorded verdict:
evidence for the claim
- The constrained phase then manufactured a common question; its five comparable answers span −0.006 to −0.45
- Conclusions can agree while estimates cannot even be compared – the two robustness questions that Multi100 was built to separate (Aczel et al. 2026)
Free-phase records: the public Multi100 dataset (osf.io/q5h2c), which contains only categorical verdicts and free-text reports. The models themselves were read from the analysts’ public code.
Two studies to set beside our five
The disagreement among our five analysts follows a pattern that was described first, and at far greater scale, in two studies on which the rest of this part rests.
Silberzahn and colleagues (2018) – the red-card study from earlier, in which twenty-nine teams analysed one dataset to answer one question. Twenty of the twenty-nine intervals excluded 1, and nine did not.
Auspurg and Brüderl (2021) went back through all twenty-nine of those analyses and asked a question that the original had not: what was each team actually trying to measure?
The first establishes that careful people disagree, and the second explains why.
Four estimands in the red-card study
Auspurg & Brüderl re-read the 29 analyses and found four different estimands:
descriptive association · discrimination net of mediators · variance-maximising · exploratory
The dispersion came largely from a multiverse of questions, rather than from a multiverse of analyses.
Auspurg and Brüderl (2021)
Red-card estimates with and without a fixed estimand
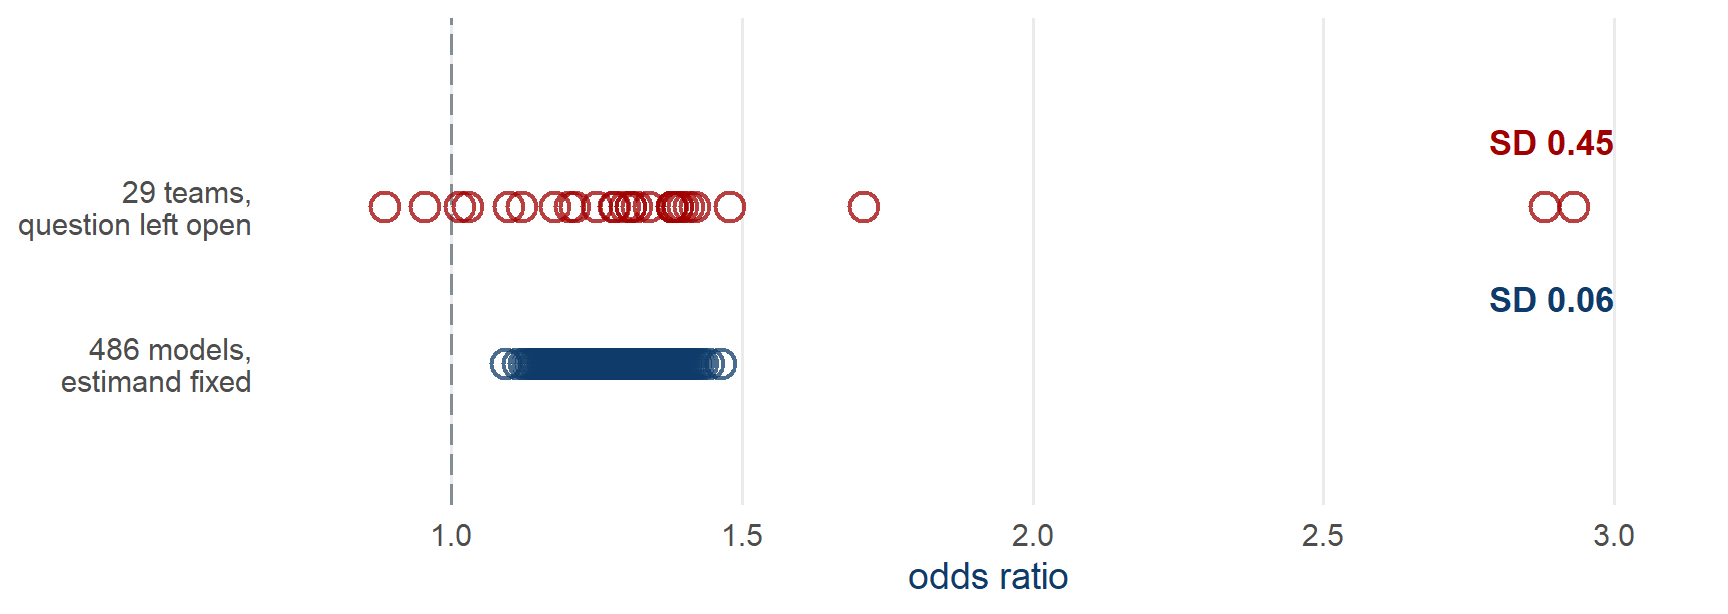
- Fix the question, derive the model space from a DAG, and run all 486 justifiable models: the SD falls from 0.45 to 0.06
- The 0.45 in the top row comes mostly from two analyses, the outliers beside a tight cluster
Auspurg and Brüderl (2021). Top row: the 29 published estimates. Bottom row: drawn to their reported median (1.28) and SD (0.06) – the 486 values are not published.
Under-specified research questions
Auspurg and Brüderl put the question in their title: has the credibility of the social sciences been credibly destroyed?
If the twenty-nine teams answered four different questions, most of their disagreement is not evidence that analysis is unreliable.
It is evidence that the question was under-specified – an ordinary, fixable defect.
Read this way, the many-analyst literature is a diagnosis of vague research questions rather than a verdict on social science.
This reading is more optimistic, and also more demanding, because it places the problem with whoever writes the question.
Auspurg and Brüderl (2021)
Theoretical and empirical estimands
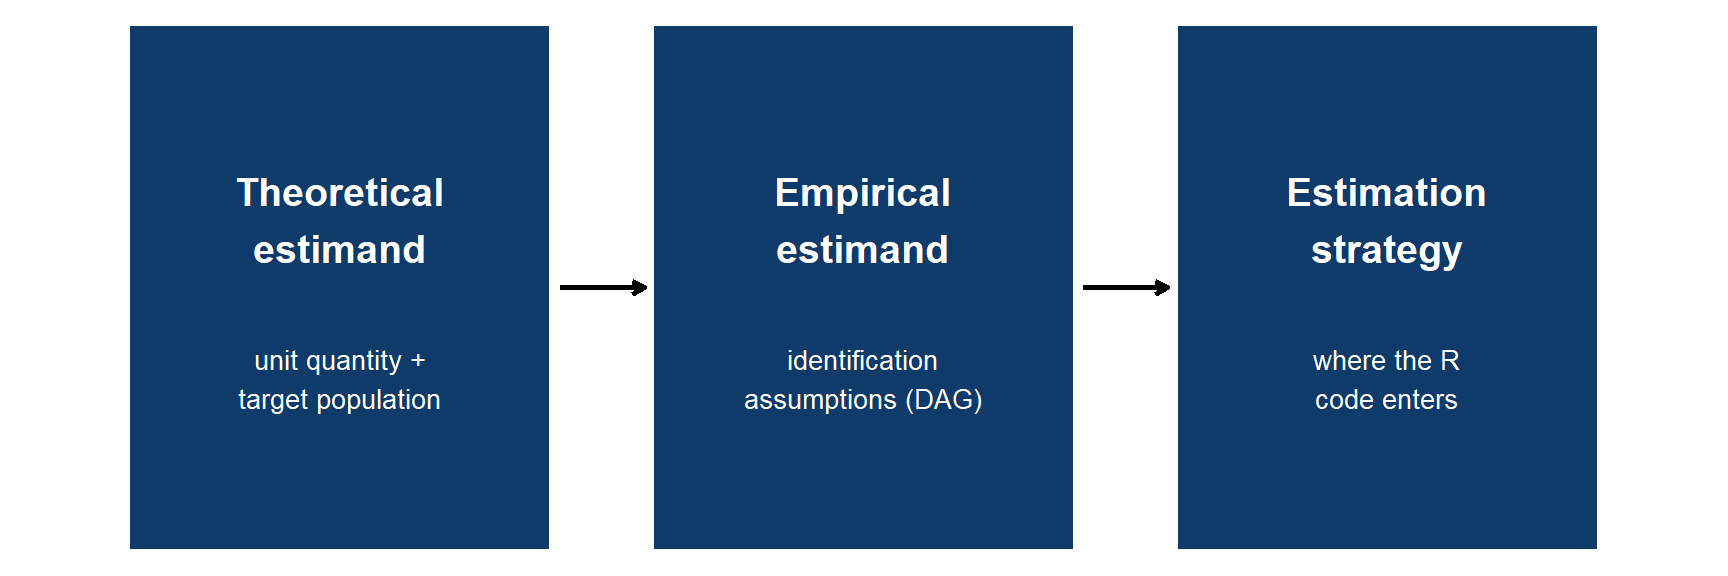
- The theoretical estimand is stated outside any model – before R opens
Lundberg et al. (2021).
Confounders, mediators and colliders
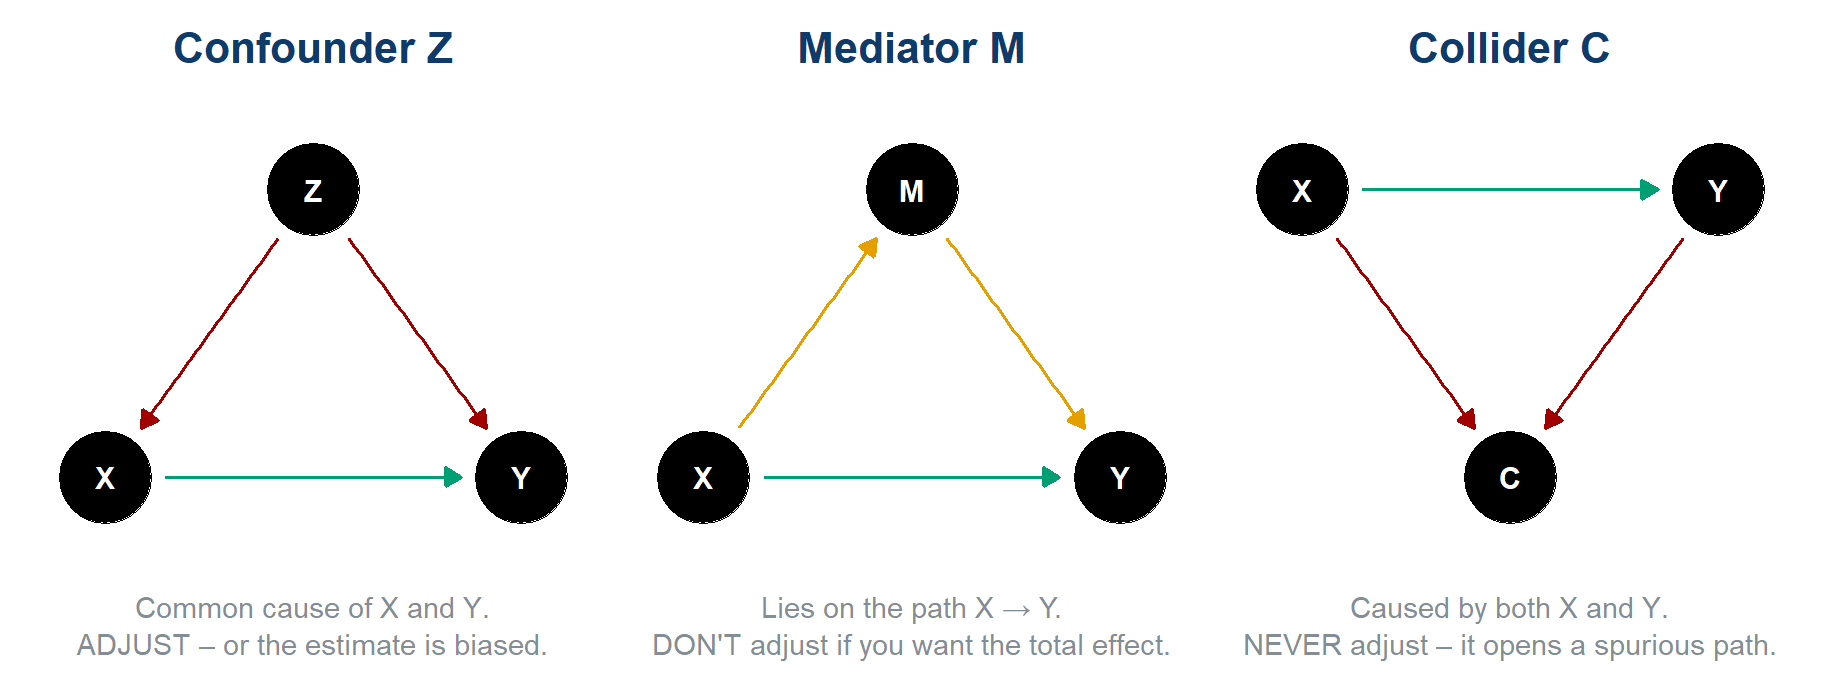
X = predictor, Y = outcome. Green = the causal effect you want; coloured = the path you must reason about.
Causal stories behind a correlation
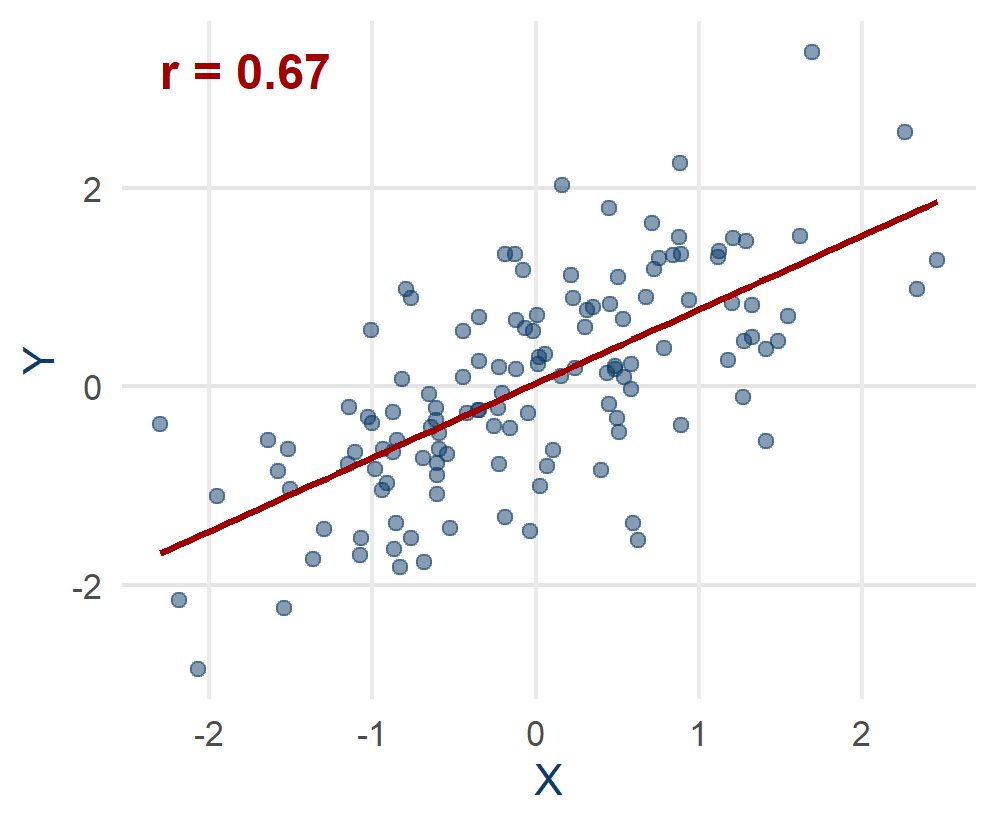
The same slope fits four different stories:
- X really causes Y – the slope is the effect
- a common cause inflates it – confounding
- the sample itself is selected – collider / selection
- Y causes X (reverse causation), or it is chance
The data look identical in all four. Only an assumption about how the data arose can tell them apart, and a DAG is where you write that assumption down.
Reading a DAG: open and closed paths
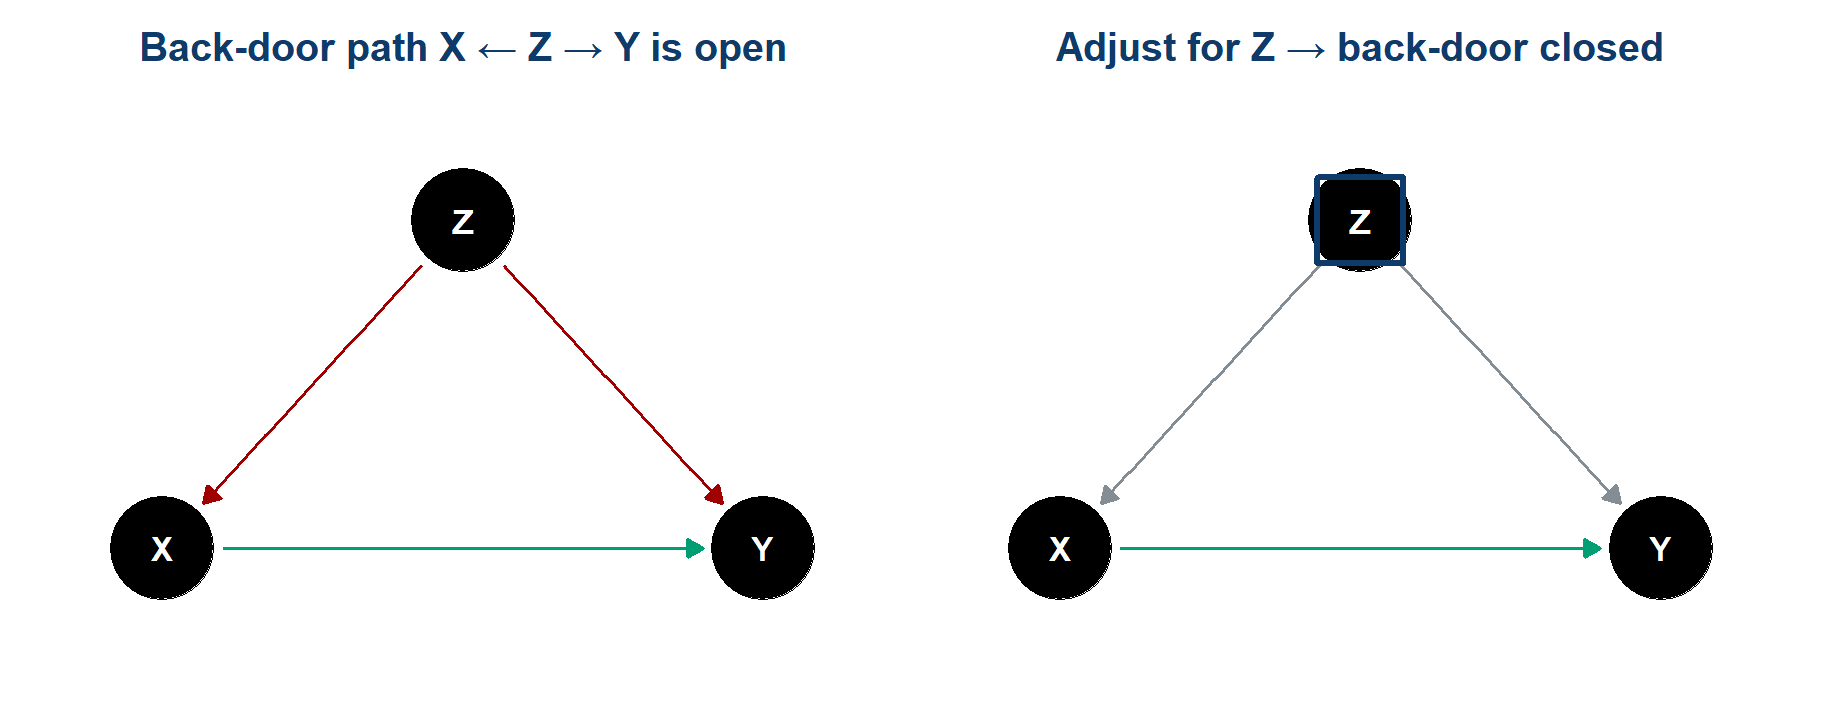
Association flows along every open path, not only along the causal arrow. A fork or a chain is open until you adjust for the variable in its middle. A collider is the reverse: shut by default, and opened when you adjust for it.
- Back-door criterion: close every path that enters X from behind, keep the causal X → Y path open
- Only an adjustment set that does this supports a causal reading
Total effect or direct effect
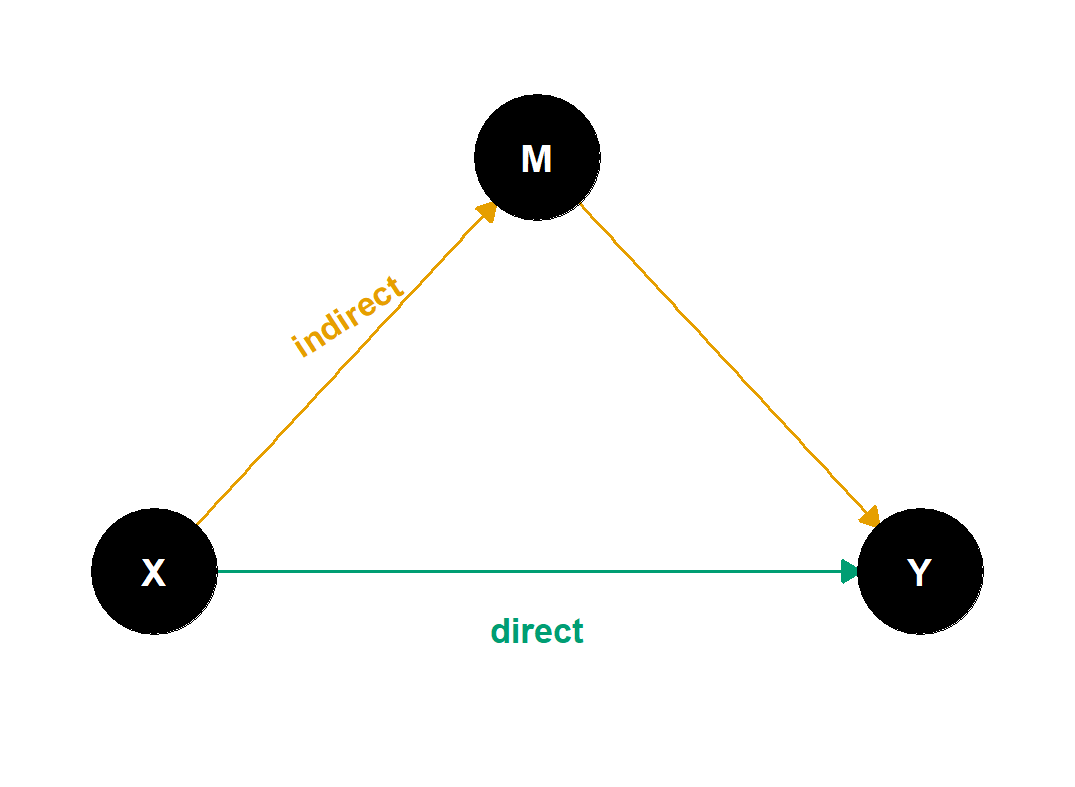
- Total = direct (green) + indirect (amber)
- Adjust for the mediator M → you estimate the direct effect only – a different estimand
Control for everything
can switch you to an estimand you never chose- Table 2 fallacy: the other coefficients in your model are not all causal effects
Selection and feedback
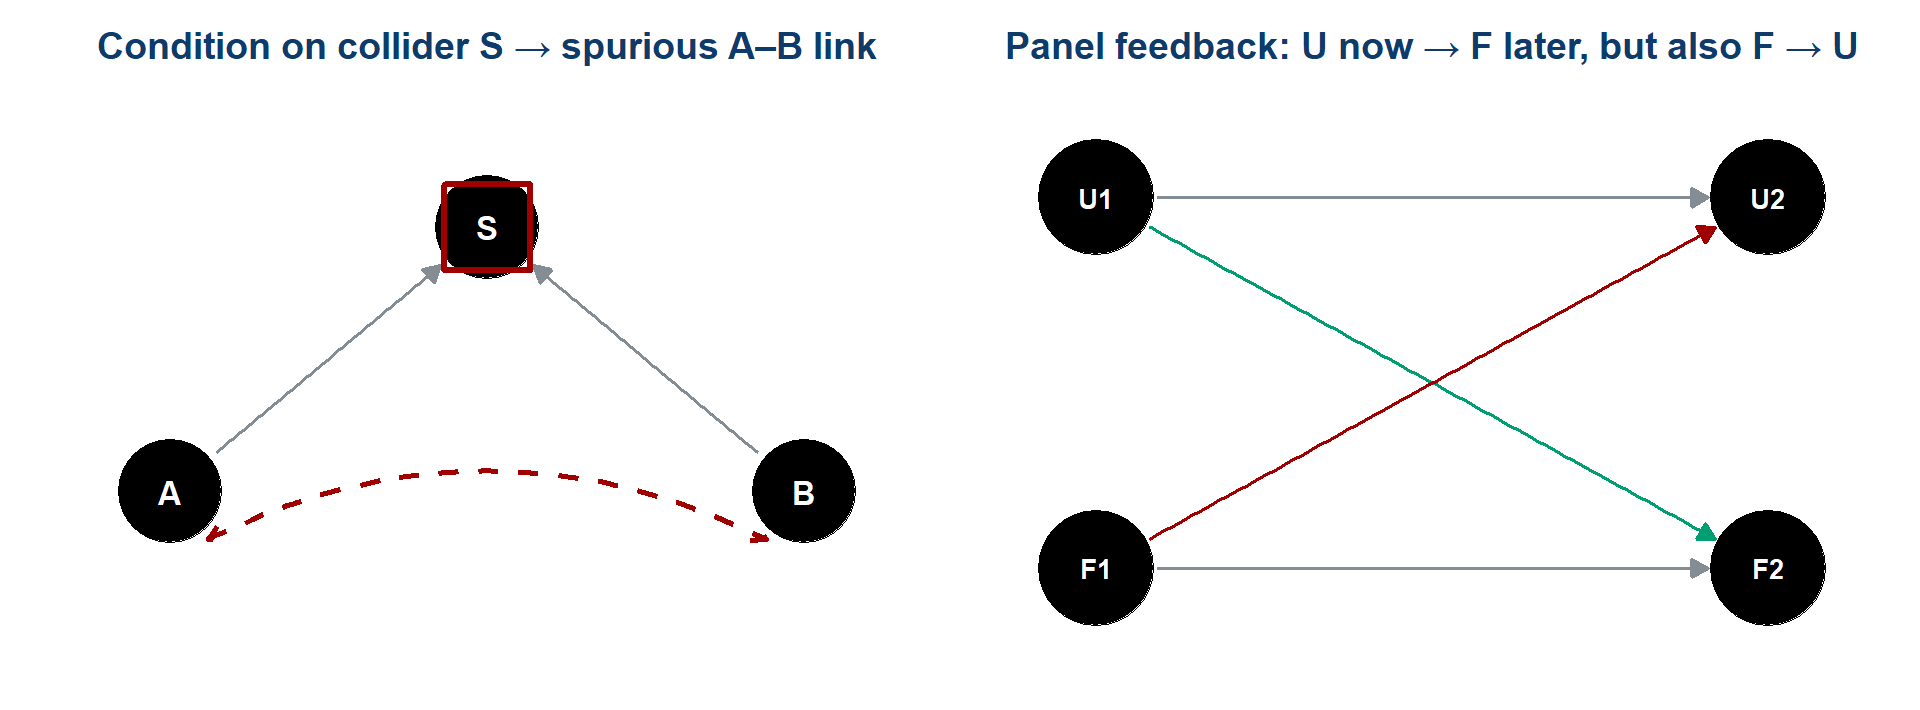
- Selection / collider bias – conditioning, or merely sampling, on a common effect manufactures an association that was never there (much of the early COVID risk-factor literature)
- Reverse causation & feedback – in a panel, today’s outcome can move tomorrow’s predictor; two-way fixed effects absorb stable country traits and common-year shocks, not time-varying feedback (U = unemployment, F = framing)
Revenons à nos moutons
The expected change in [unit quantity] among [target population] for a 1-percentage-point difference in unemployment, holding [assumptions] fixed.
- Unit quantity – a person’s cosmopolitan framing, or a country-year mean?
- Target population – which countries, which years?
In chat, now: your one-sentence estimand for the claim. Type it, hold it, send on go
.
Causal identification in this design
Observational panel · 27 countries · no assignment mechanism · feedback between the variables · a decade of shared shocks.
Nothing in this design licenses unemployment causes a shift in EU framing
.
So why draw a causal graph at all?
Because the graph still does three jobs that do not need identification:
- It says which association you are after – for instance the total effect, rather than whatever the software returns
- It tells you which variables belong in the model, and, just as usefully, which do not
- It makes your assumptions legible and arguable – a reader can disagree with an arrow, and that is a productive disagreement
Publishing the estimand and the graph
The graph and the estimand are only worth anything if they are published where someone else can read them:
- in the paper itself
- before the model runs, not reconstructed afterwards
- with the limitations named by you before a reviewer finds them
In Task 5 you enter all of that in a block of the report in your workspace – the estimand, the graph-based justification, the one specification, and the rule for what would count as support – and you do it before you run the model.
The technical name for that is preregistration, and it fixes the question before anyone knows the result.
The EU-frames DAG, half built
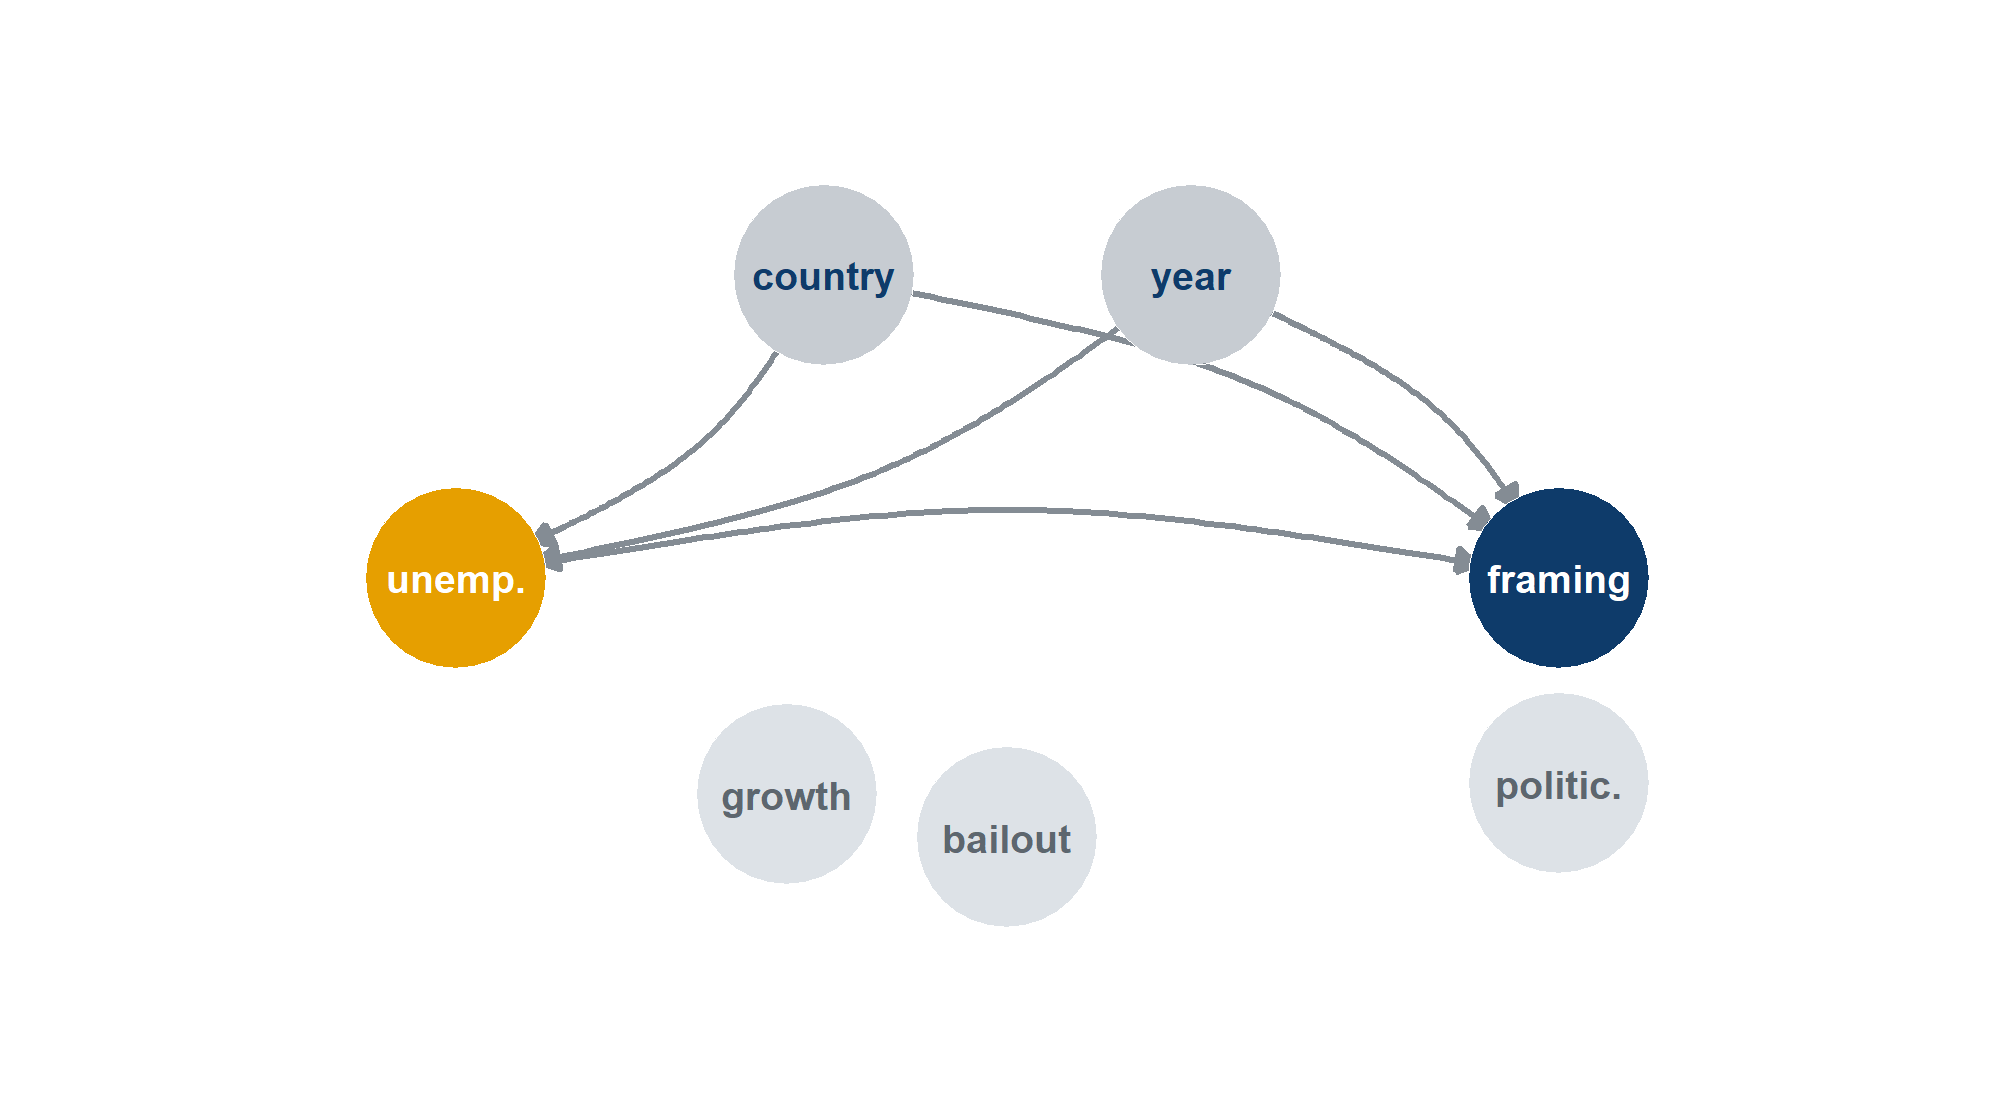
The same graph in R. Every arrow is a formula, read outcome-first – so a # takes an arrow out and the code still runs:
- Drawn: the path of interest and two confounders, country and year, which two-way fixed effects adjust for
- Not yet wired: growth (confounder?) · bailout (mediator?) · politicisation (mediator?)
- Your part: add the edges you believe, then run
adjustmentSets()
R, in one slide
With four pieces of syntax you can read most R: assign with <- · call a function with name(...) · reach into an object with $ · chain with the pipe |>.
Getting data in
What comes back is a data frame: a rectangle, one row per observation, one column per variable, each column of a single type. Almost everything in R takes a data frame and gives you one back.
library() makes the functions in a package available. It does not install it – that is install.packages(), and it happens once, not every time.
Inspecting the data
Every serious error I have made in twenty years of this was visible in the data before it reached a model – a duplicated year, a missing value coded as -9, a scale running 1–10 where I assumed 0–1.
Working with rows and columns
Read it downwards as a sentence: take the panel, then keep 2008 onwards, then keep four columns, then add a centred unemployment column, then sort by unemployment, highest first.
The sixth verb is summarise(), usually with group_by(): collapse many rows into one per group. That is how the panel you are working on was built from 390,000 respondents.
Model formulas
The tilde ~ reads outcome on the left, predictors on the right. Add predictors with +. The formula is an object in its own right and is not tied to the function that will eventually use it.
Almost every modelling function in R takes this same shape: something(formula, data = ...). Learn the pattern once and lm, glm, lmer, feols and betareg all become variations.
Fixed effects with fixest
The bar | separates the regression from the fixed effects. Everything after it is absorbed: cntry gives every country its own intercept, year gives every year its own.
The equivalent with dummies would be mcosmo ~ unemp_c + factor(cntry) + factor(year) – same estimate, 36 extra rows of output you do not want to read.
This is the model that you reproduce in Hands-on 3, where it gives t = −3.804.
Reading what comes back
- estimate – a one-point rise in unemployment goes with a fall of 0.00347 on a 0–1 framing scale
- std.error – how much that estimate would wobble across repeated samples
- statistic – the t: the estimate divided by its standard error. Roughly, how many standard errors from zero
- p.value – how often you would get a t this large if the true value were zero
broom::tidy() returns the table as a data frame, so you can filter it, join it, plot it. That is how 840 model fits become one chart when we reach the multiverse.
Plotting with ggplot2
Three parts, always: the data, the mapping (aes) from variables to visual properties, and one or more geoms that draw something. Layers stack with +.
facet_wrap repeats the whole plot once per group. One line of code gives twenty-seven small country panels, and you can see which countries move.
Causal graphs in R
Each line is one arrow, read outcome-first, following the same convention as a model formula. Because every arrow has its own line, you can comment one out with a # and the code still runs.
adjustmentSets() returns the variables that close every back-door path in the graph. Change an arrow, rerun, and watch the answer change.
Common error messages
| What you see | What it usually means |
|---|---|
could not find function "feols" |
The package is not loaded – add library(fixest) above |
object 'euframes' not found |
You ran this chunk before the one that creates it – go back up and run in order |
object 'unemp_c' not found |
The column does not exist yet – you skipped the mutate() that makes it |
+ on the console, nothing happens |
An unclosed bracket or quote. Press Esc and look for the missing ) |
Read the error. R error messages are terse but almost always literally true, and most of them name the thing that R could not find.
Hands-on 2 – The panel, the estimand and the causal graph
Task 2 has three pieces:
- Look at the data. 270 rows, 27 countries, 10 years. Run the country panel plot and find the ones that move
- Write the estimand in words. The template gives you the unit quantity, the target population, the aggregation – fill in each for this claim
- Wire up the DAG. Take the
#off the arrows you are willing to defend, rerunadjustmentSets(), and check which adjustment set it now returns
Two sentences for your notes: what do two-way fixed effects adjust for, and what can they not fix?
Whatever you decide here becomes your starting point on the menu in Task 4, and the justification you preregister in Task 5.
Lunch
An hour – the return time is in the chat · lunchtime browsing, if you like: the specification menu
PART 3 – Reproduction and the specification menu
Part 3 · 90 minutes
Task 2 of Multi100
Focus on the
Cosmopolitan
dimension for EU framing and on the unemployment rate as the independent variable; disregard contextual variables.
Three instructions. Everything else – estimator, sample, weighting, functional form, how you build the scale – was left to us.
Multi100 was designed to fix just enough to make the numbers comparable and to leave the rest free, so that what remained would be a measurement of analytical variability itself.
What those three instructions assume
The cosmopolitan dimension
assumes that the five items form one scale, and that the summary used in the paper, each respondent’s share of mentions, is the right one. A mean, a sum, or a factor score would all be defensibleThe unemployment rate
assumes that the claim is about unemployment. The abstract of the paper sayspoor economic performances
– which also names GDP growthDisregard contextual variables
removes the country-level controls. That makes results comparable across analysts and gives up any defence against a time-varying confounder
None of these is wrong. Each one is a decision, made for you, that a different study could reasonably have made differently.
The EU-frames panel
EUframes_cy.csv – 270 rows, one per country-year · 27 countries · 2004–2013
| Column | What it is |
|---|---|
cntry, year |
the cell |
mcosmo |
mean cosmopolitan framing in that country-year, 0–1 |
mutil, mcomm, mlib |
the other three framing scales |
mpos, mneg |
the two composites – all positive items, all negative items |
unemp, growth |
national unemployment rate and GDP growth |
n_cy |
how many survey respondents are behind the cell |
bailout |
1 if an EU/IMF assistance programme was running |
n_cy is the interesting one: cells are built from very different numbers of people, which is why weighting is a live choice on the menu.
Analyst no. 6
- Aim 1: reproduce analyst C6HJR’s constrained result
What Multi100 asked: focus on the
cosmopolitan
dimension and on the unemployment rate; disregard the contextual variablesWhat I submitted: a two-way fixed-effects model,
mcosmo ~ unemp_c | cntry + yearWhat Multi100 recorded: t ≈ −3.80 (df = 233, N = 270, partial r ≈ −0.242)
Hands-on 3 – Reproducing the recorded result
- Task 3 in your workspace or in the browser lab – the constrained specification: outcome
mcosmo, unemployment centred, country and year fixed effects - The data are one file,
EUframes_cy.csv, loaded as the objecteuframes - In the working script the model is written out for you to run; the browser lab version has gaps to fill, with two hints and a full solution
Target: t = −3.804 – the value recorded for analyst C6HJR in the Multi100 dataset. When you have it, type your t in chat and hold it until I say go
.
Reproducibility and analytical choice
Thirty of you just got t = −3.804, to the third decimal. That is reproducibility, and it is the easy R.
You all ran the same code. The five Multi100 analysts each wrote their own and came back with five different answers.
None of them was careless. They made different choices, and the options that they chose from make up the menu.
The specification menu
| Axis | Options |
|---|---|
| Outcome | mcosmo · mutil · mcomm · mlib · mpos · mneg |
| Outcome family | gaussian · beta (logit link, for a bounded 0–1 scale) |
| Predictor | unemployment · GDP growth |
| Predictor form | raw · log (unemployment only – growth goes negative) |
| Copredictor | none · the other macro measure |
| Estimator | two-way FE · country FE · random effects · pooled OLS |
| Sample | all · 2004–2008 · 2009–2013 · no bailout countries · no Greece and Spain |
| Weights | none · n_cell · n_eff · pop |
Eight of the fourteen axes. The other six – scoring rule, no-opinion handling, item set, cell weighting, published series and standard errors – are on the specification menu page, with copy-paste code for every option.
Two of these axes already varied in the red-card study, where the 29 teams split across four response distributions (outcome family) and four ways of handling non-independence (estimator).
What Task 2 of Multi100 left open
The three instructions fixed the outcome dimension, the predictor and the contextual controls. Everything else stayed open – including one thing that few people think of as a choice:
The unit of analysis. Two of the five fitted models on individual respondents; three worked on aggregates. Task 2 never said which, and the wording did not imply one.
Their five answers all obeyed the three instructions and still ran from r = −0.006 to r = −0.45, so the freedom that remained was enough to produce the whole spread.
The choices that move an estimate most are usually made before any model is fitted.
Ground rules for the menu
In Hands-on 4 the rule is: change one axis, hold the other thirteen at baseline.
Baseline = the specification you reproduced in Hands-on 3: mcosmo · gaussian · unemployment · raw · no copredictor · two-way FE · all years · unweighted · share of mentions · standard measurement settings · conventional SEs.
Changing one axis at a time keeps the class chart readable. Every dot differs from a common baseline on exactly one axis, so when a dot moves you can say what moved it.
And one convention binds everyone: claim-alignment. The negative framings are reverse-coded, 1 − y, so that supports the claim
reads as a negative sign whatever your outcome. Without it the class chart would straddle zero by construction and look like noise.
The six framing scales
| Scale | Items | Claim predicts |
|---|---|---|
mcosmo |
peace · democracy · free movement · diversity · voice | negative |
mutil |
prosperity · social protection | negative |
mcomm |
unemployment · identity · crime · borders | positive |
mlib |
bureaucracy · waste of money | positive |
mpos |
all seven positive items | negative |
mneg |
all six negative items | positive |
The claim says decrease positive dimensions
– mpos is the more literal reading, mcosmo is what was instructed. Across all six scales, the choice of outcome accounts for roughly half the variance in the grid as estimated, most of it because positive and negative framings take opposite signs. The disagreement between mpos and mcosmo accounts on its own for 0.15%.
Building a scale – mean, sum or share
Five binary items per respondent. Three defensible summaries:
- Mean of the five – a proportion between 0 and 1. Everyone contributes equally
- Sum – a count from 0 to 5. The same information on a different scale, which changes the size of the coefficient
- Share of all mentions – depends on how many options the respondent picked overall
A share is relative to the respondent’s own total, so somebody who ticked eight boxes contributes differently from somebody who ticked two. The mean and the sum do not depend on that total.
Among the five Multi100 analysts, one used a mean, one a sum, one a share and one three separate shares. Each choice is defensible, but no two of them measure the same quantity.
Claim alignment
Reverse-coding a bounded scale flips the sign of b, t and r, and leaves the magnitude, the standard error, the |t| and the p-value untouched. The same holds exactly for the beta family, since logit(1 − μ) = −logit(μ).
Your evidence stays the same, and only the sign convention in which it is reported changes.
It is still an analytic decision, so it is set by an explicit claim_align switch in your preregistration, where a reader can find it.
A bounded scale in a linear model
Our outcome is a proportion. It lies strictly between 0 and 1, and its variance is smallest near the ends. A linear model assumes neither of those things.
- Gaussian – fit it as if it were unbounded. Simple and familiar, but it can in principle predict values outside 0–1
- Beta – a logit-link beta regression, built for bounded outcomes of this kind. It reports a z in place of a t
Fitted as a beta regression, the baseline gives b(logit) = −0.01399, z = −4.075, r = −0.258, against r = −0.242 from the gaussian fit, so the association keeps its direction and its significance and is marginally stronger.
The choice of distribution matters in principle, and on this claim it changes the result very little.
The predictor – unemployment or GDP growth
The abstract says poor economic performances
. That names at least two things:
- Unemployment rate – what Task 2 of Multi100 instructed. Higher is worse
- GDP growth – what four of the five analysts used in their free phase, two of them beside unemployment. Higher is better, so the claim predicts a positive coefficient on positive framings
Refitted on our panel, the free-phase model of analyst C6HJR (mpos ~ growth + unemp, two-way fixed effects) puts the growth coefficient at b = +0.00167, t = 1.59, in the direction predicted by the claim but not significant.
Across all the growth specifications in the grid, 70.5% point in the direction predicted by the claim, but only 46.9% are significant. Direction without significance is a different kind of support from the one that the unemployment specifications give.
Predictor form
- Raw
unemp– a one-point rise in the rate - log(unemp) – a proportional rise, so the step from 4% to 5% counts for more than the step from 20% to 21%
Those two are genuinely different models and can give different answers.
But centring and standardising are not. Subtracting a mean, or dividing by a standard deviation, is an affine change of scale: it moves the coefficient and its standard error by the same factor and leaves t, r and p exactly unchanged.
For that reason the grid has no separate centred rows. A robustness check that varies only the centring is the same analysis restated.
Four ways to handle countries and years
| Estimator | What it compares | What it assumes |
|---|---|---|
| Pooled, clustered SE | countries with each other and over time | no unobserved country differences |
| Country FE | each country with itself over time | country differences are stable |
| Two-way FE | the same, net of EU-wide year shocks | shocks hit everyone alike |
| Random effects | a weighted blend of both comparisons | country effects uncorrelated with the predictor |
The four estimators address different questions. A pooled estimate is about whether high-unemployment countries frame the EU differently, a fixed-effects estimate about whether a country frames it differently when its own rate rises.
Of the 41 cosmopolitan specifications with the wrong sign, opposite to the one that the claim predicts, 33 are pooled.
What fixed effects adjust for
Absorbed
- Anything stable about a country over the decade – institutions, history, size, prior EU sentiment
- Anything common to a year across all countries – the crisis itself, a treaty, a media cycle
Not addressed
- A confounder that varies within a country over time – a national bailout, a change of government
- Reverse causation: today’s framing moving tomorrow’s unemployment
- Measurement error, selection into the sample
This is the same statement as the DAG from Hands-on 2. adjustmentSets() on its solid part, before any of the pale nodes is wired in, returns country and year, which are what two-way fixed effects absorb, so the graph and the baseline model make the same claim.
The copredictor
Put GDP growth in beside unemployment and you have made a choice you should be able to name:
- As a confounder – a slump raises unemployment and sours sentiment in the same year. Adjusting closes a back-door path that your fixed effects leave open
- As a rival exposure – growth is a second measure of the same
poor economic performance
. Now you are asking which of the two the claim is about - As a mediator – if unemployment works through growth, adjusting removes part of the effect you wanted
The line of code is the same in all three cases, but each reading of it targets a different estimand. And remember the Table 2 fallacy, which is to read every coefficient in a regression table as a causal effect. The growth coefficient in that model is not automatically the causal effect of growth.
Sample restrictions
- All – 2004–2013, 27 countries, 270 cells
- 2004–2008 vs 2009–2013 – before and during. The split halves your data and tests whether the relationship is a crisis phenomenon
- No bailout countries – drop the cells where an EU/IMF programme was running
- No Greece and Spain – drop the two extreme unemployment trajectories
The last two exclusions test whether the association depends on a handful of extreme cases, which would be a reason for concern. In this grid, 24 of the 41 wrong-sign specifications come from samples that leave out the bailout countries.
An exclusion is a claim about who the finding is meant to be about, and so it is a question about the estimand.
Weights
Each cell is a mean of very different numbers of respondents. Weighting by n_cy makes a cell built from 2,000 people count for more than one built from 500.
- Unweighted – every country-year is one observation. You are studying countries
- Weighted by
n_cy– cells count in proportion to the people behind them. You are closer to studying people
That changes the estimand, which is why the weight is one of the fourteen axes of the menu, beside the outcome and the estimator.
Practical note: random effects are never fitted with weights in the grid – the combination is not well defined for this design, so those rows do not exist.
Making the axes comparable
A coefficient from a beta model on a share and one from a weighted pooled model on a sum are not on the same scale. Multi100 and this course put them on one scale in three steps:
- Take the test statistic and its degrees of freedom
- Convert to a partial correlation r – the association between predictor and outcome, net of everything else in the model, on a fixed −1 to +1 scale
- Apply claim alignment, so the sign means the same thing everywhere
Every specification in the class, and all 840 in the grid, can then be placed on one axis. submit_exploration() in Task 4 and report_result() in Task 5 do the conversion for you.
Standardising makes numbers comparable, not equivalent. Two analyses that estimate different quantities remain different after the conversion, even when they are plotted side by side.
Silberzahn’s teams faced the same problem: four of the twenty-nine reported a correlation or a standardised difference rather than an odds ratio. The authors converted everything to one scale and reported the median. A median summarises the estimates in one number, where a curve shows their whole distribution, and which of the two you want depends on what you mean to say next.
Hands-on 4 – Exploring the menu
Task 4 is exploratory. Try several specifications, look at what each one does, and get a feel for which axes move the estimate.
- Start from the baseline you reproduced
- Change one axis in
try_spec()and read what happens to b, t and the partial r;my_experiments()lists every try - Do it again with a different axis. Three or four is plenty
- Then rerun the one you can argue for best with
try_spec(), so that it is your last try, and submit it withsubmit_exploration()
Your dot appears on the live Multiverse page within seconds, and we read the dots from the whole class once everyone has submitted.
This is not your preregistered analysis. You are allowed to look, change your mind and try again, which is why this phase has a name of its own.
Break
30 minutes – the return time is in the chat · leave the Multiverse page open
PART 4 – Multiverse and preregistration
Part 4 · 90 minutes
Your own small multiverse
You ran three or four specifications, all defensible, and watched the estimate move.
Nothing about that is unusual. Every analysis you have ever published came from a space like that – you reported one point from it.
The multiverse idea is the proposal that the space is itself a finding, and that showing one point without it is a form of incomplete reporting.
Where the idea comes from
- Multiverse analysis (Steegen et al. 2016) – developed for data-processing choices: how you code, exclude and combine. Report the whole set of datasets that your choices could have produced
- Specification curve analysis (Simonsohn et al. 2020) – the same move for model choices, plus a visual grammar: estimates on top, the choices that produced each one underneath
- The vibration of effects – the same idea, arrived at independently in epidemiology
- The book-length treatment (Young and Cumberworth 2025) – computational recipes at scale
Under all these names the proposal is the same: stop treating your analytical choices as invisible, and enumerate them.
The garden of forking paths
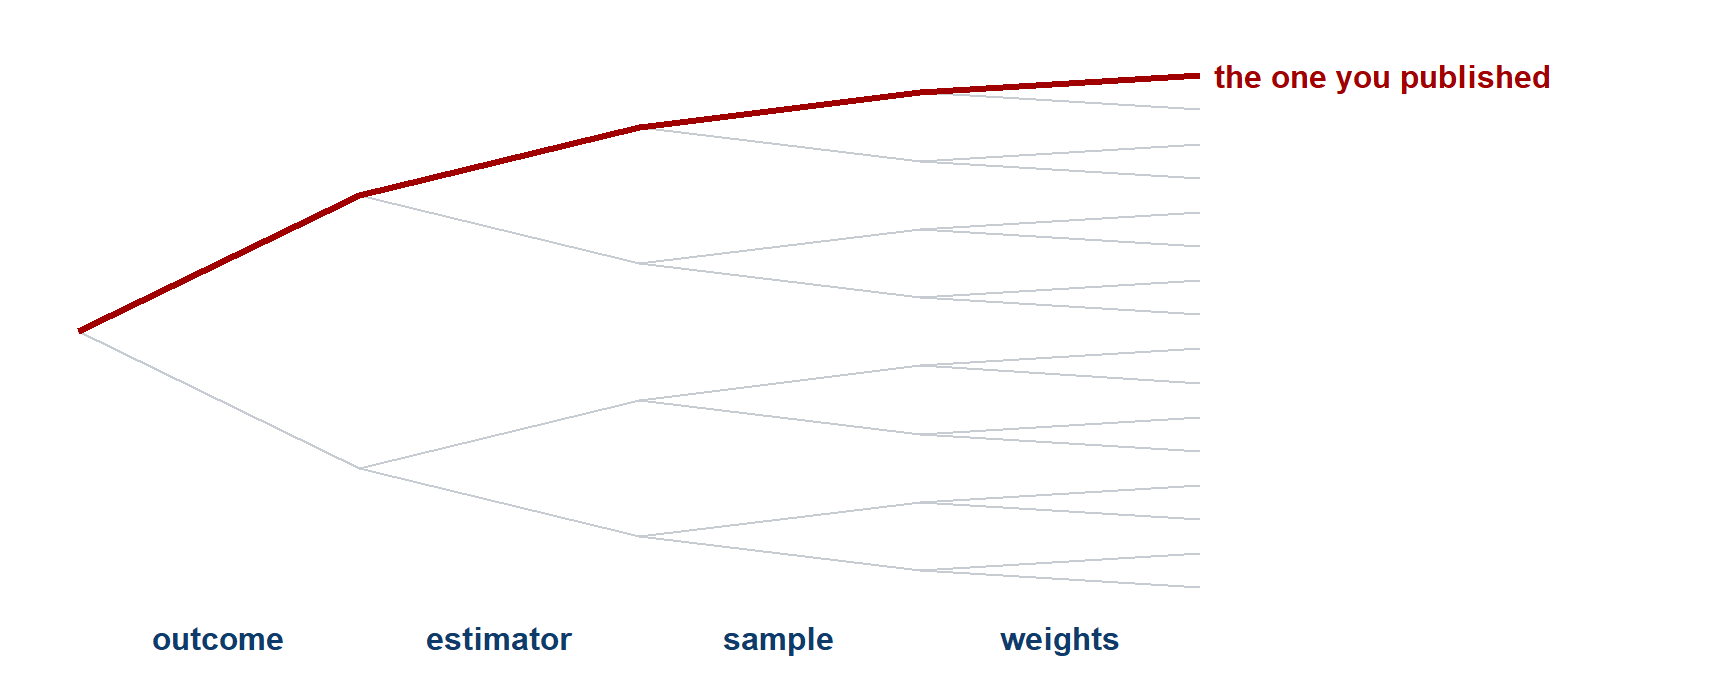
Four binary choices give sixteen analyses. Fourteen axes with several options each give hundreds of thousands. The published paper reports one red line and no tree.
Filters for inclusion
Two filters decide which of the analyses you could run go into a multiverse:
- Justifiability – could you defend this specification to a reviewer, in writing, before seeing its result?
- The same estimand – does it estimate the quantity you said you were after?
Drop the first filter and you get a cloud of nonsense that makes any finding look fragile. Drop the second and you are averaging over answers to different questions – which is the red-card mistake, at scale.
Our grid is a curated 840, chosen against both filters. That curation is itself an analytical decision, and it is the one that a critic should attack first.
Enumeration and curation
Enumerate
Cross every option on every axis. Complete, mechanical, reproducible.
Risk: the set fills up with specifications nobody would defend, and the spread stops meaning anything.
Curate
Include only the specifications you would actually defend.
Risk: you are choosing the set, so a sceptic can ask whether you chose it to get the picture you wanted.
Either way, the set is a claim, and it belongs in the paper alongside the curve, ideally preregistered before the curve is drawn.
Multiplying the menu out
Our menu, multiplied out:
- 6 outcomes × 2 predictor forms × 2 copredictor settings × 4 estimators × 5 samples × 2 weightings, minus the combinations that are not defined → 840 distinct analyses
- Add the outcome family axis → the family universe of 1,680
- Add GDP growth as the claim carrier → 2,520, the universe on the results page
- Open the four regression weights, the scoring rule, the four measurement decisions – what happens to no-opinion respondents, which items, design-weighted cells or not, which published series – and the standard-error convention → 449,280 linear specifications, 461,760 rows once the beta twins and the two imputation engines are in
- Open the unit of analysis as well – person level or aggregate – and the arithmetic doubles again
Two consequences. Compute stops being free, so somebody must decide what is worth running. And you cannot look at 450,000 numbers – you need a picture, and a way to ask which axis is doing the work.
Purposes of a multiverse
Rohrer, Hullman and Gelman’s question, and it has three different answers that need three differently built universes:
- Reflection – to understand your own analysis. Which choices matter, where the argument has to happen. Build it broad, and read it yourself
- Persuasion – to convince a reader that the finding is not an artefact of one path. Build it from specifications that your critic would accept
- Inference – to make a probabilistic statement about the curve as a whole. Build it to a rule fixed in a preregistration, and bring a null distribution
Our grid was built for reflection. Reading it as inference is a mistake that we take apart later.
Rohrer et al. (2026)
Decomposing the variance by fork
Once you have hundreds of estimates and the choices that produced each one, you can ask a question that no single analysis can answer: how much of the variation does each axis account for?
- Treat the specification grid as data: one row per analysis, the axes as factors, the estimate as the outcome
- Decompose the variance across axes
The answer is the most useful thing a multiverse produces, because it tells you where to spend your argument. An axis that moves nothing does not need defending, while an axis that moves everything needs a paragraph.
On this claim, the answer surprises almost everybody who guesses it in advance.
Reading a specification curve
Five questions to ask any curve you meet, in any paper:
- What is on the vertical axis – a raw coefficient, or something standardised? Are the signs aligned so that up and down mean the same thing throughout?
- How was the set built – enumerated or curated, and by whom?
- Where does the published estimate sit – at the median, or out at an end?
- Is the spread patterned – does one axis produce the extremes, or is it scattered?
- What null is the significance shading against – and are the specifications independent? (They almost never are.)
Answered for your own curve, the five make a publishable robustness section.
The class multiverse
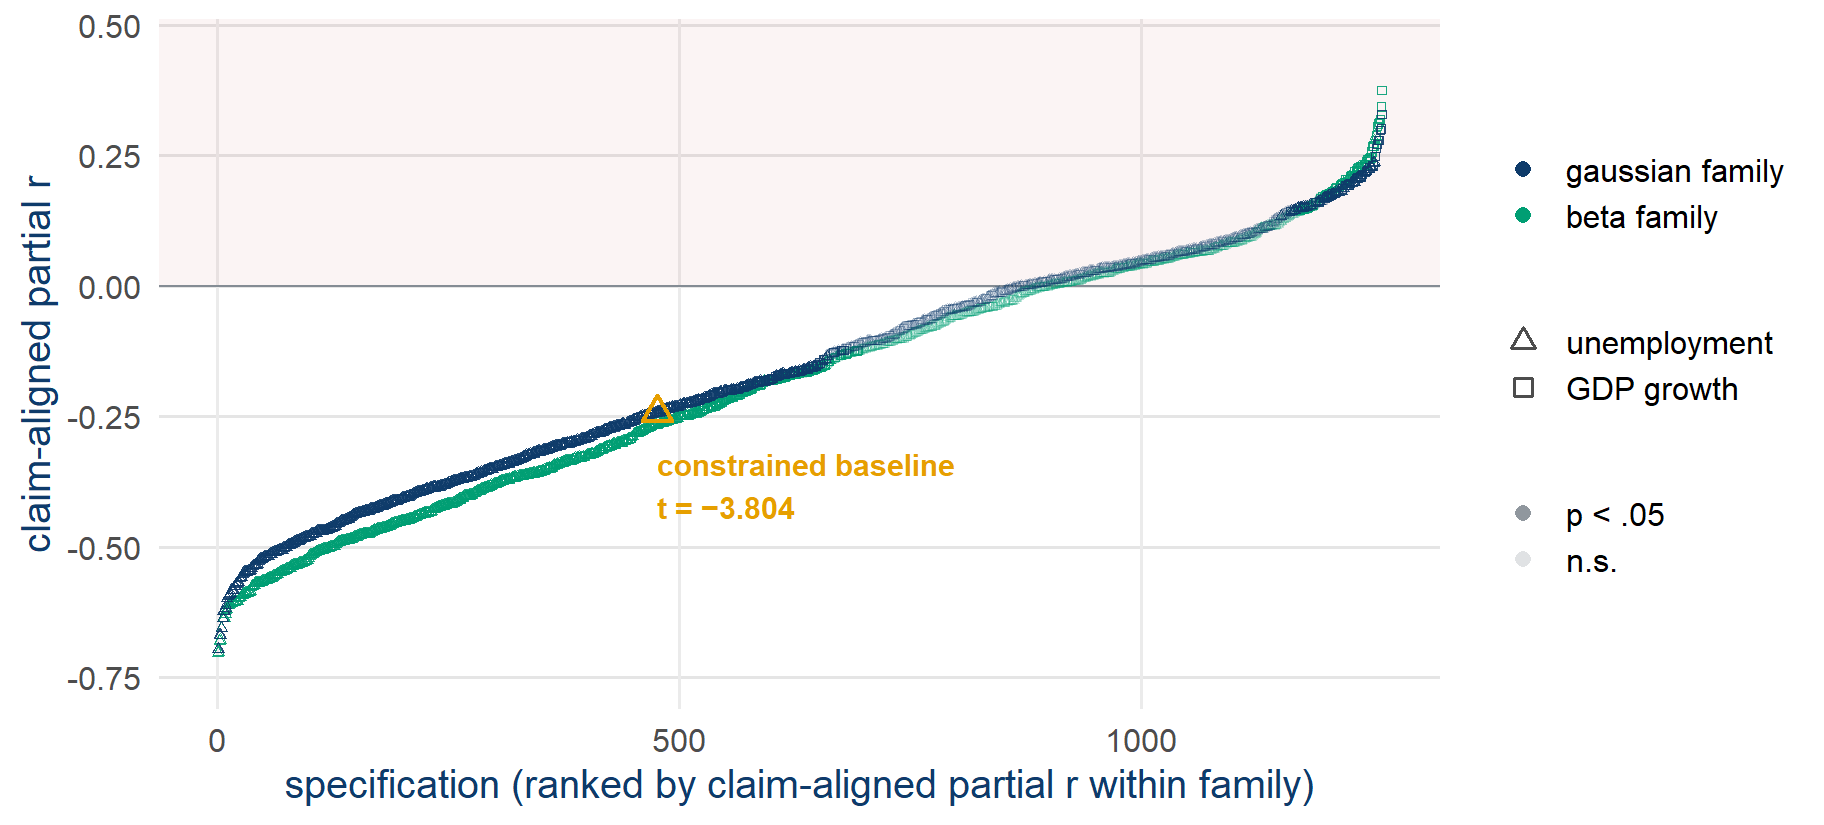
- The universe of 2,520 specifications: the Multi100 grid of 840 (blue unemployment triangles) plus the outcome-family and predictor axes, all at the standard measurement settings
- The grid of 840: 68.7% claim-consistent direction · 63.9% significant · claim-aligned partial r from −0.70 to +0.24
Pre-computed over the specification menu (data/spec_grid_full.csv), claim-aligned – negative framings reverse-coded and growth predictors sign-flipped, the convention that the preregistration block in Task 5 records (claim_align = TRUE).
The published results on the curve
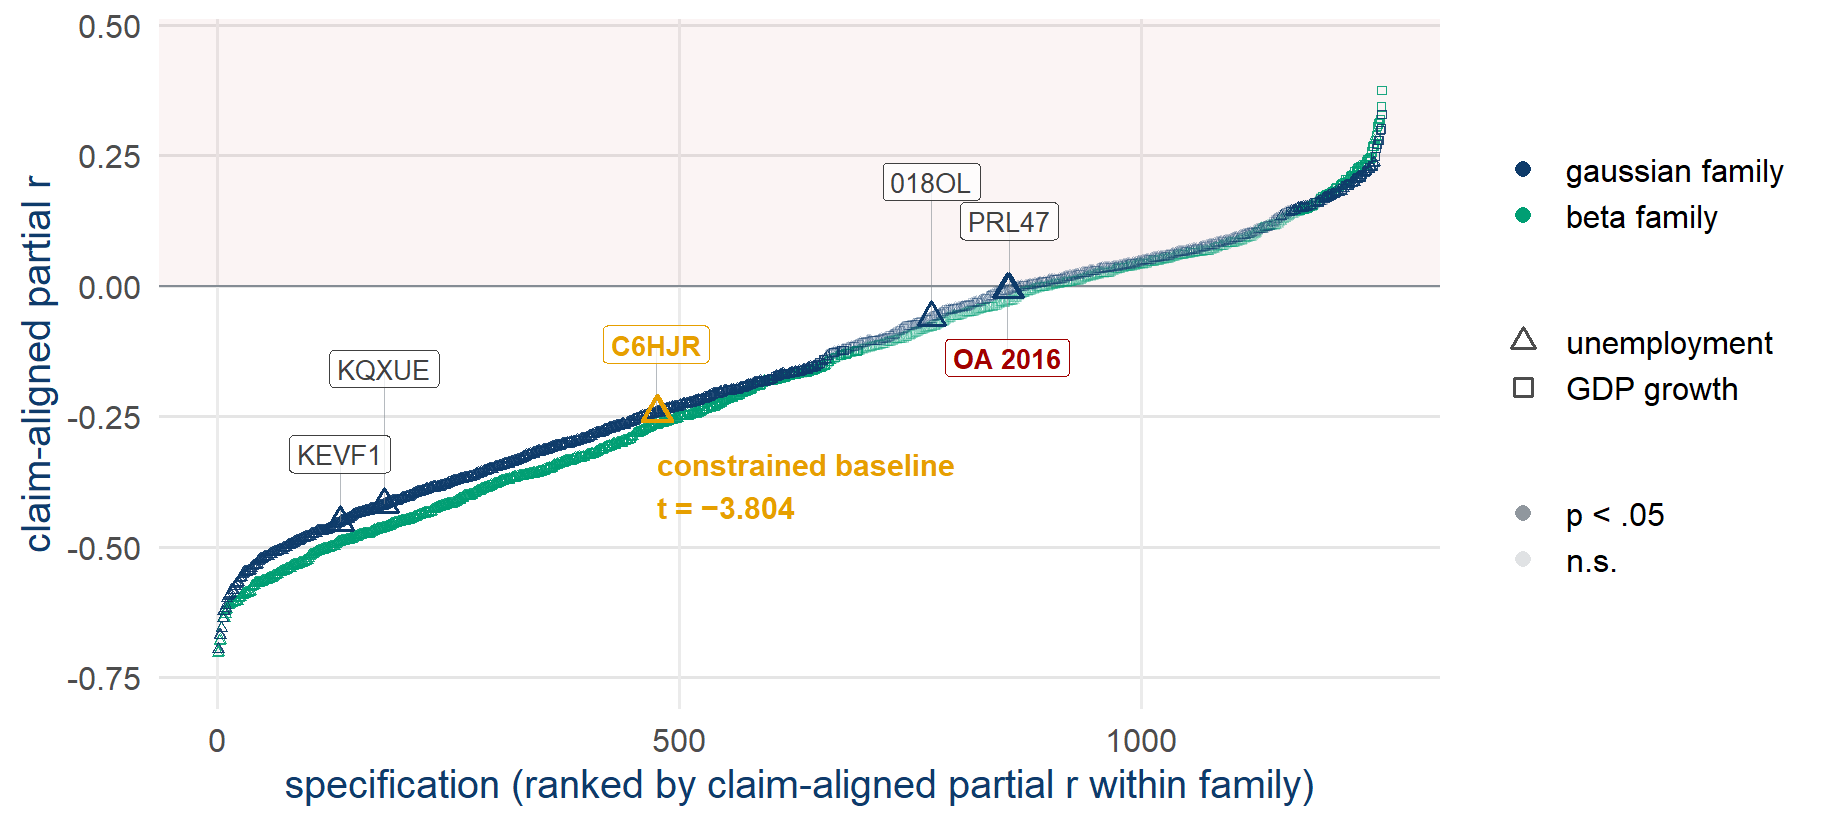
Your own dots are on the live Multiverse page, drawn on this same chart
submit_exploration() in Task 4 and report_result() in Task 5 each give you a one-click link to the Google Form; results appear on the Multiverse page.
A bet on the six axes
Six axes: outcome · predictor form · estimator · copredictor · sample · weights
Which axis moves the estimates most across all 840 specifications?
Type your guess – hold it – send on go
.
Fork importance
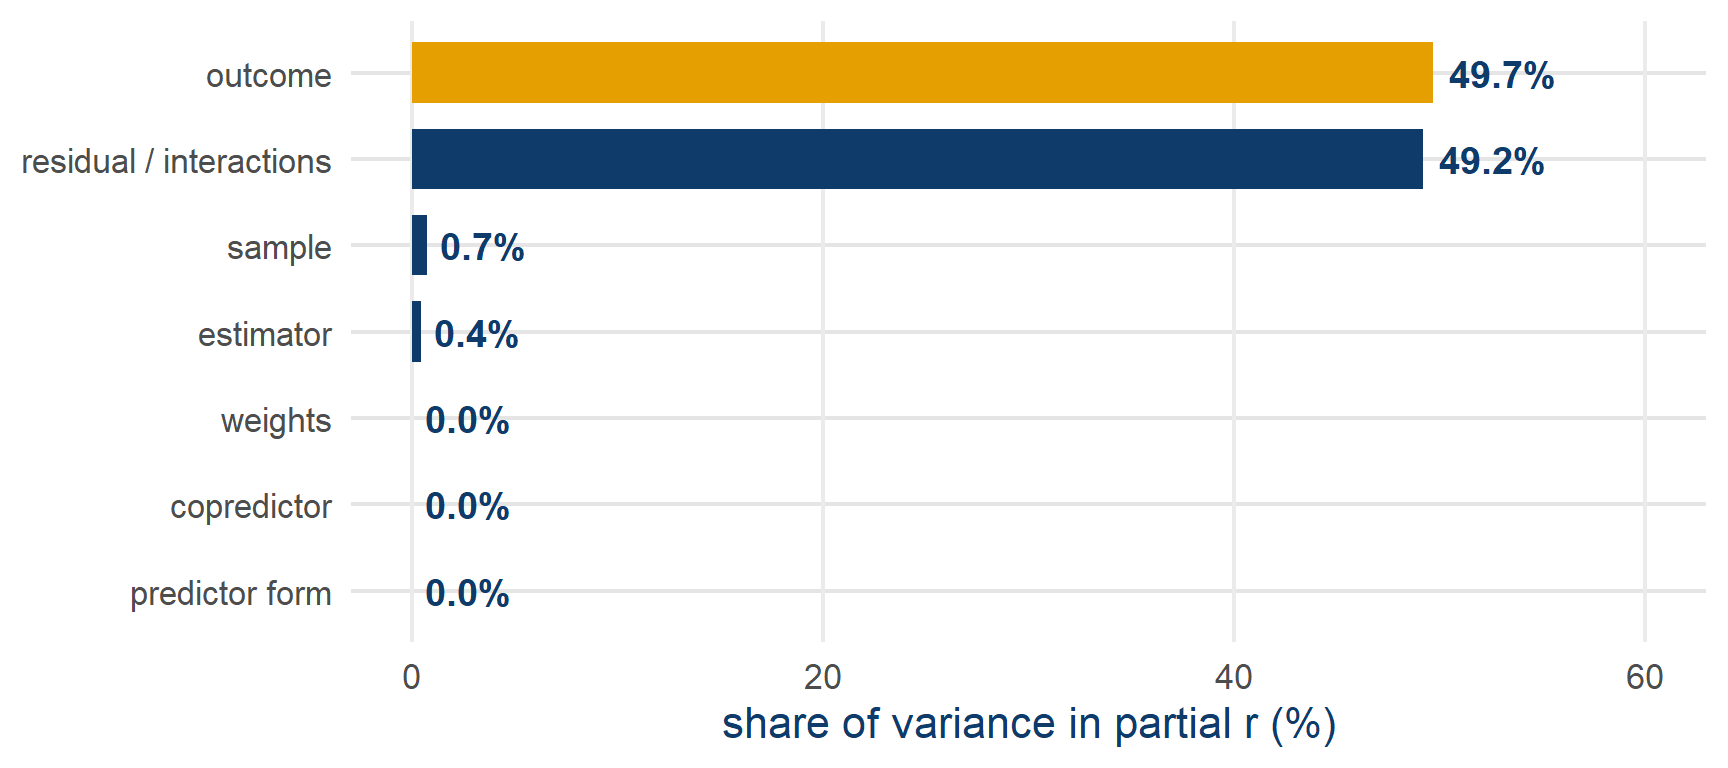
- Outcome operationalisation: 49.7% of specification variance · estimator + predictor form + copredictor + weights together: under 2%
- Computed on the grid as estimated – most of the outcome share is the polarity split between positive and negative framings, the split that the claim-aligned chart removes from display
Computed over the committed data/spec_grid.csv; imported as data/fork_importance.csv.
The five analysts in the grid
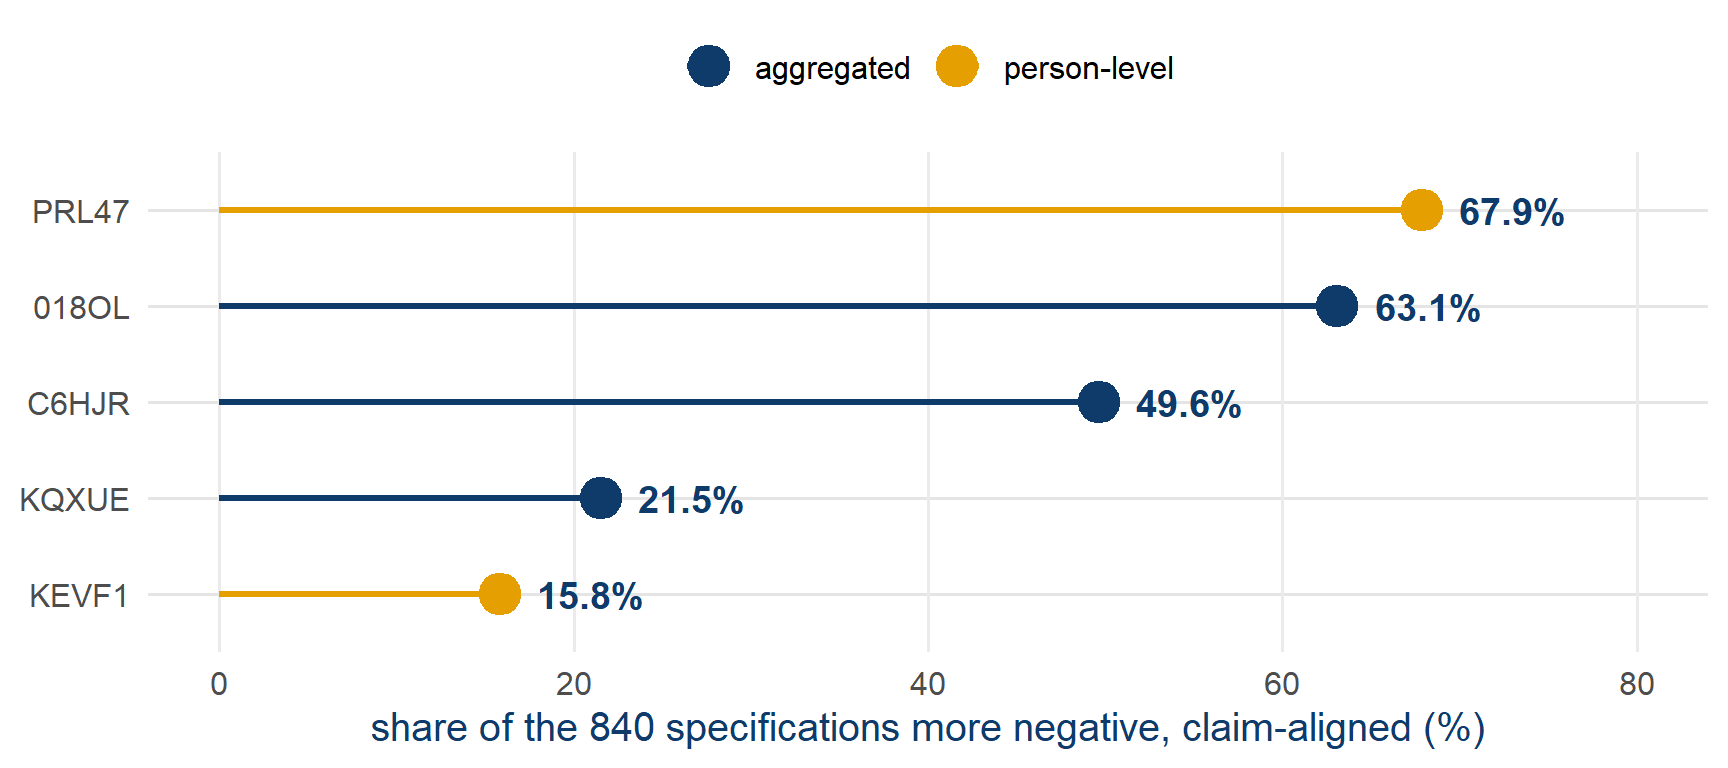
- The two person-level analysts are at the two extremes of the recorded range, so the unit of analysis and the metric matter more than the software or the estimator
Sign flips by estimator and sample
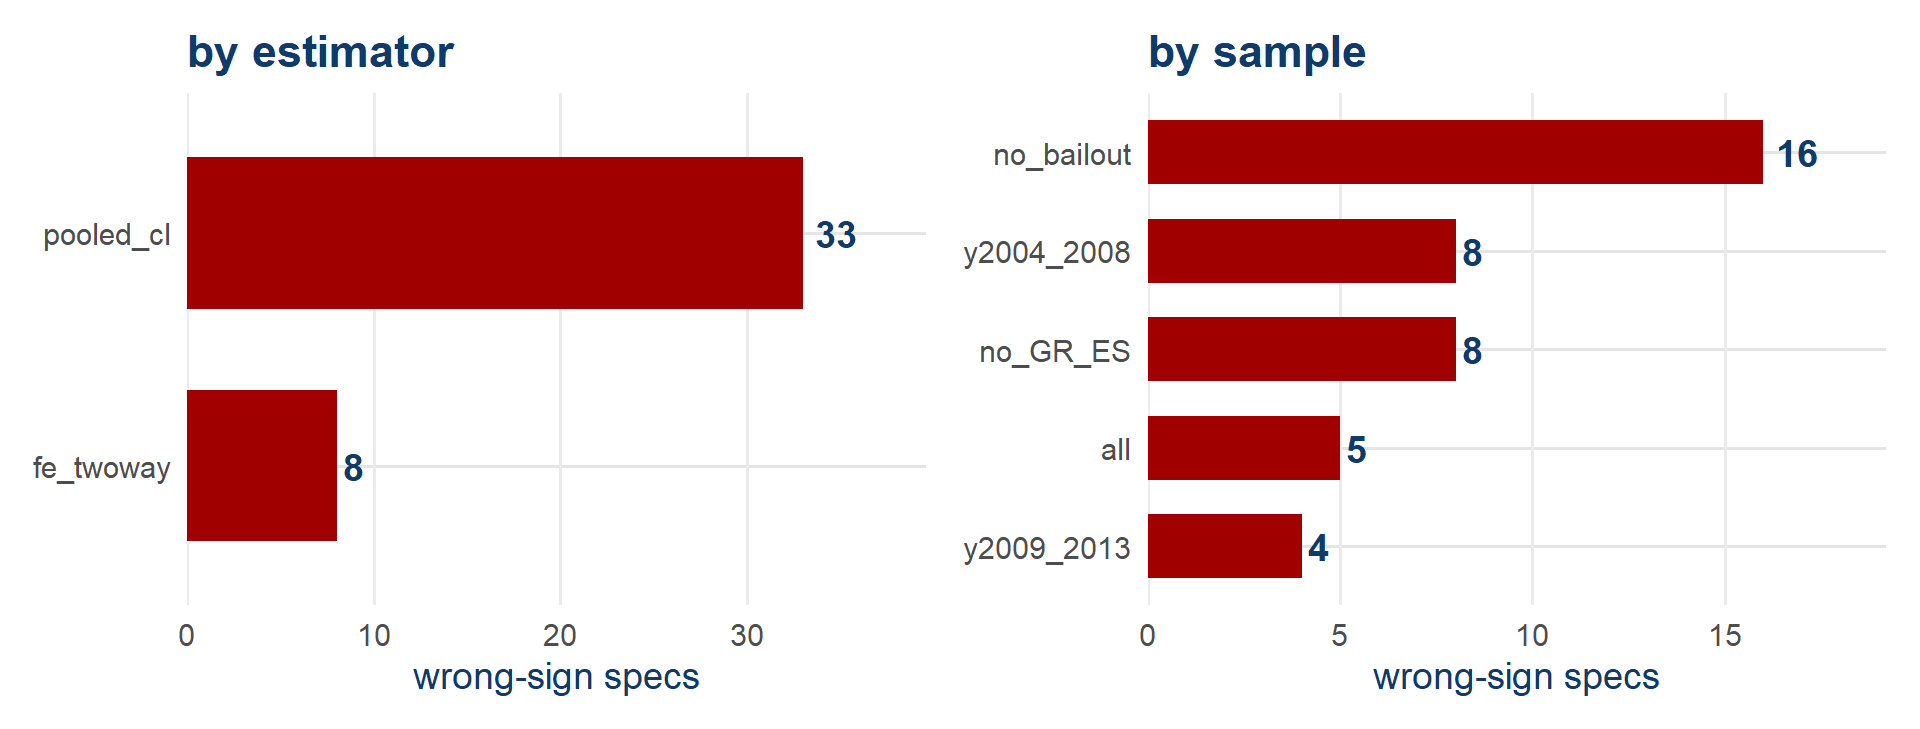
- In the cosmopolitan-only universe, the wrong-sign estimates concentrate in the pooled cluster-robust estimator and the bailout-excluding samples
Your own percentile
- In the browser lab, rerun
try_spec()with the choices you submitted in Task 4: its output includes your placement. Everyone uses the lab for this step, because the workspace does not print it - The placement is the share of the 840 specifications more negative than yours, on the claim-aligned scale
- The same statistic that placed the five analysts, computed for you
Paste your percentile in chat – hold – send on go
.
What the curve leaves out
- The specifications nobody ran. Person-level models, a different scale construction, a lagged predictor. The curve contains nothing from outside the menu, and looks just as complete either way
- The dependence. All 840 use the same 270 country-years, so they share their noise, and the width of the cloud cannot be read as 840 independent results
- Estimand drift. Some of these specifications answer subtly different questions. The chart puts them on one axis; that does not make them commensurable
- The data-building choices. Everything upstream of the panel – how the scales were coded, which waves were pooled – is fixed for everyone here
A curve is a map of the menu you wrote, and it cannot show whether that menu was the right one.
Description and inference
Description – map how the estimate moves across every defensible choice. (What our curve does.)
Inference – ask whether the curve as a whole is surprising if there were no effect at all. (A different, harder job.)
The two are detachable, and most published curves stop at description.
Dependence among the 840 estimates
Every specification re-uses the same 270 country-years. The estimates are deeply dependent.
63.9% significant
describes the curve. It is not a p-value for the claim.
Vote-counting across dependent specifications has no null distribution, so a tally of significant results is not evidence for the claim on its own.
The permutation design
- Break the one link that the claim needs: shuffle each country’s unemployment series in time (jointly with growth), keeping everything else intact
- Refit all 840 specifications on each shuffled dataset · repeat B = 500 times
- Compare the observed curve to the 500 null curves: is ours more extreme than chance produces?
The design is worked through in your inference reading; permutation inference after Phipson and Smyth (2010).
Reading a curve-level test
- With B = 500, the smallest reportable p is 2/(B+1) ≈ 0.004, a floor set by the number of draws, not a zero
- Near p = .05 the Monte-Carlo error is about ±0.01, so treat p = .04 and p = .06 as the same finding
- A DESIGN · NOT YET RUN – a curve-level test has to be fully specified before anyone runs it, and this one has not been run; today we read the design only
Discussion (2 minutes, then chat): the constrained cosmopolitan-only universe has 140 specs: 70.7% negative, 57.1% negative and significant. Strong evidence? Against what null?
What stands without the test
Everything descriptive survives: the 49.7% outcome fork, the analysts’ placement, the sign-flip pattern, your dot.
Only one sentence depends on the permutation test: the curve as a whole is unlikely under no effect
.
Careful reporting says which of the two layers a claim belongs to.
Critics of the multiverse
Robustness is better assessed with a few thoughtful models than with billions of regressions
(Auspurg 2025; answering Ganslmeier and Vlandas 2025) – only justified models targeting the same estimand belong in one curve. Our grid is a curated 840, and a decomposition by fork does the job that every critic endorses: it locates where the argument must happenThere is only one correct analysis
once the question is fully specified (Lakens et al. 2026) – your preregistered specification guards against cherry-picking, and their deeper point is that preregistering a choice does not yet make it justified, which is what the estimand and DAG work were forWhat’s a multiverse good for anyway?
– reflection, persuasion, or inference, and each purpose needs a differently built universe (Rohrer et al. 2026). Ours was built for reflection, and how much more to read into it is the open debate
The one-correct-analysis argument
The argument from Lakens and colleagues runs in four steps:
- A research question, fully specified, implies a quantity to be estimated
- That quantity, together with the design and the assumptions you are willing to make, implies one analysis that estimates it
- So a spread of results is not evidence of legitimate diversity. It is evidence that most of those specifications are wrong – they estimate something else
- On this reading, showing a wide curve is closer to an admission than to a robustness check
Take it back to the red cards. Twenty-nine teams modelled one count of red cards as linear, logistic or Poisson. Those are claims about how the outcome was generated, and they cannot all be right – so on this argument most of the spread is error.
Lakens et al. (2026)
Identifying the one correct analysis
Grant the argument, and suppose that one correct analysis exists. Which one is it?
Getting there needs the estimand and the identification assumptions and agreement about the measurement – and on this claim, reasonable people disagree about all three.
So the curve complements the one-correct-analysis view: it is a map of the disagreement that remains, drawn because we cannot yet settle it.
And it points at what to argue about: on this claim, at the outcome, not at the estimator.
What preregistration settles
It does settle
- That your specification was not chosen because of the result
- That your rule for what counts as support was fixed before you had a result
- That a reader can see what you intended, and what you changed
It does not settle
- Whether the specification was any good
- Whether it estimates the quantity that your question implies
- Whether the assumptions behind it hold
A badly reasoned analysis that is preregistered is still badly reasoned; the preregistration only adds a timestamp
That is why the estimand and the DAG came first today: preregistration protects a choice, and the causal reasoning is what justifies it.
Exploration and preregistration
- Aim 2: assess the robustness of the constrained result
In Task 4 you explored: several specifications, tried in order to find out what they do. That was the right way to learn them
In Task 5 you preregister one specification: it goes into the preregistration block of your report before it runs, with a reason that your DAG supports
The code is identical. The difference is that one of these can be chosen because of its result and the other cannot
Hands-on 5 – The preregistration
- Open the preregistration block in your report
- Complete fields 1–5: the claim, the data-in-hand statement, your one specification, the one-sentence justification from your DAG, and your rule for what supports or undermines the claim
- Render, or on the browser lab page copy the completed cell into your notes
- Type
declared
in chat – then wait for the class
Nobody runs a model until everyone in the class has completed their preregistration block.
Hands-on 5 – The preregistered run
- Task 5 – run the specification in your preregistration, and only that one
report_result()prints a one-click link to the Google Form with your results already in it – click, submit- Your dot joins the Multiverse page as a declared result (the chart’s name for a preregistered specification), beside the exploratory ones from Task 4
Compare the two waves. If the preregistered dots fall systematically to one side of the exploratory ones, it is worth discussing why.
Stuck? Chat STUCK
· reload and rerun · second browser · follow my screen · last resort: the grid lookup on the menu page gives you the results for your specification by hand
Two points from the literature
the common single-path analyses in social and behavioural research should not be simply assumed to be robust to alternative analyses
(Aczel et al. 2026)
A blueprint: precise question → causal reasoning (DAG) → multiverse → sensitivity analysis (Auspurg and Brüderl 2021)
- Same-conclusion robustness and same-number robustness are different bars
- Justifiability is the criterion – choose with reasons, show the spread
The single analytical path
There is no privileged single analytical path – only justifiable ones, explored openly.
You made one justifiable choice today, preregistered it with its reason before running it, and placed it inside a multiverse.
codemoreh.github.io/applied-replication
Everything is open, and you can fork any of it.
What you take with you
- Yours now: a rendered report with its preregistration block · an estimand statement and a causal graph that you wrote yourself · two dots on the class chart, one exploratory from Task 4 and one preregistered from Task 5
- Read: the three Nature 2026 papers (Miske et al. 2026; Aczel et al. 2026; Tyner et al. 2026) · the glossary (Nosek et al. 2025) · Auspurg and Brüderl (2021) · Lundberg et al. (2021) · Lakens et al. (2026) · Teney (2016)
- Explore: the sixteen companion modules (among them intro to R · Quarto documents · the statistics behind today · causal graphs · the multiverse debate · simulation · the individual level · repositories & preregistration · git & GitHub) · the Multi100 data ·
fixest&ggdagdocs - Keep going locally: the research-software and open-research teams at your university · a ReproducibiliTea journal club near you
- Everything is on the course site, and everything is open – fork any of it
References
Aczel, Balazs, Barnabas Szaszi, Harry T. Clelland, et al. 2026. “Investigating the Analytical Robustness of the Social and Behavioural Sciences.” Nature 652 (8108): 135–42. https://doi.org/10.1038/s41586-025-09844-9.
Alipourfard, Nazanin, Beatrix Arendt, Daniel M Benjamin, et al. 2021. Systematizing Confidence in Open Research and Evidence (SCORE). 46mnb_v1. SocArXiv. https://doi.org/10.31235/osf.io/46mnb.
Auspurg, Katrin. 2025. “Robustness Is Better Assessed with a Few Thoughtful Models Than with Billions of Regressions.” Proceedings of the National Academy of Sciences 122 (43): e2521917122. https://doi.org/10.1073/pnas.2521917122.
Auspurg, Katrin, and Josef Brüderl. 2021. “Has the Credibility of the Social Sciences Been Credibly Destroyed? Reanalyzing the ‘Many Analysts, One Data Set’ Project.” Socius 7 (January): 23780231211024421. https://doi.org/10.1177/23780231211024421.
Breznau, Nate, Eike Mark Rinke, Alexander Wuttke, et al. 2022. “Observing Many Researchers Using the Same Data and Hypothesis Reveals a Hidden Universe of Uncertainty.” Proceedings of the National Academy of Sciences 119 (44): e2203150119. https://doi.org/10.1073/pnas.2203150119.
Cole, Stephen R., Robert W. Platt, Enrique F. Schisterman, et al. 2010. “Illustrating Bias Due to Conditioning on a Collider.” International Journal of Epidemiology 39 (2): 417–20. https://doi.org/10.1093/ije/dyp334.
D’Agostino McGowan, Lucy, Travis Gerke, and Malcolm Barrett. 2024. “Causal Inference Is Not Just a Statistics Problem.” Journal of Statistics and Data Science Education 32 (2): 150–55. https://doi.org/10.1080/26939169.2023.2276446.
Ganslmeier, Michael, and Tim Vlandas. 2025. “Estimating the Extent and Sources of Model Uncertainty in Political Science.” Proceedings of the National Academy of Sciences 122 (25): e2414926122. https://doi.org/10.1073/pnas.2414926122.
Gelman, Andrew, and Eric Loken. 2014. “The Statistical Crisis in Science.” American Scientist 102 (6): 460–66. https://doi.org/10.1511/2014.111.460.
Griffith, Gareth J., Tim T. Morris, Matthew J. Tudball, et al. 2020. “Collider Bias Undermines Our Understanding of COVID-19 Disease Risk and Severity.” Nature Communications 11 (1): 5749. https://doi.org/10.1038/s41467-020-19478-2.
Hernán, Miguel A., and James M. Robins. 2020. Causal Inference: What If. Chapman & Hall/CRC.
Huntington-Klein, Nick. 2021. The Effect: An Introduction to Research Design and Causality. Chapman & Hall/CRC. https://theeffectbook.net/.
Ioannidis, John P. A. 2005. “Why Most Published Research Findings Are False.” PLoS Medicine 2 (8): e124. https://doi.org/10.1371/journal.pmed.0020124.
John, Leslie K., George Loewenstein, and Drazen Prelec. 2012. “Measuring the Prevalence of Questionable Research Practices with Incentives for Truth Telling.” Psychological Science 23 (5): 524–32. https://doi.org/10.1177/0956797611430953.
Keele, Luke, Randolph T. Stevenson, and Felix Elwert. 2020. “The Causal Interpretation of Estimated Associations in Regression Models.” Political Science Research and Methods 8 (1): 1–13. https://doi.org/10.1017/psrm.2019.31.
Lakens, Daniel, Sajedeh Rasti, and Mehmet N. Tunç. 2026. There Is Only One Correct Analysis. PsyArXiv. https://osf.io/preprints/psyarxiv/hvjxf_v1/.
Leszczensky, Lars, and Tobias Wolbring. 2022. “How to Deal with Reverse Causality Using Panel Data? Recommendations for Researchers Based on a Simulation Study.” Sociological Methods & Research 51 (2): 837–65. https://doi.org/10.1177/0049124119882473.
Lundberg, Ian, Rebecca Johnson, and Brandon M. Stewart. 2021. “What Is Your Estimand? Defining the Target Quantity Connects Statistical Evidence to Theory.” American Sociological Review 86 (3): 532–65. https://doi.org/10.1177/00031224211004187.
Miske, Olivia, Anna Lou Abatayo, Mason Daley, et al. 2026. “Investigating the Reproducibility of the Social and Behavioural Sciences.” Nature 652 (8108): 126–34. https://doi.org/10.1038/s41586-026-10203-5.
Munafò, Marcus R., Brian A. Nosek, Dorothy V. M. Bishop, et al. 2017. “A Manifesto for Reproducible Science.” Nature Human Behaviour 1 (1): 0021. https://doi.org/10.1038/s41562-016-0021.
Nosek, Brian A, Timothy M Errington, Noah Haber, Theresa Stankov, and Andrew H Tyner. 2025. A Brief Glossary of Terms about Repeatability: Replicability, Robustness, and Reproducibility. mqfp4_v1. MetaArXiv. https://doi.org/10.31222/osf.io/mqfp4_v1.
Open Science Collaboration. 2015. “Estimating the Reproducibility of Psychological Science.” Science 349 (6251): aac4716. https://doi.org/10.1126/science.aac4716.
Phipson, Belinda, and Gordon K. Smyth. 2010. “Permutation P-values Should Never Be Zero: Calculating Exact P-values When Permutations Are Randomly Drawn.” Statistical Applications in Genetics and Molecular Biology 9 (1): Article 39. https://doi.org/10.2202/1544-6115.1585.
Rohrer, Julia M., Jessica Hullman, and Andrew Gelman. 2026. What’s a Multiverse Good for Anyway? PsyArXiv. https://osf.io/preprints/psyarxiv/37g29_v1/.
Silberzahn, R., E. L. Uhlmann, D. P. Martin, et al. 2018. “Many Analysts, One Data Set: Making Transparent How Variations in Analytic Choices Affect Results.” Advances in Methods and Practices in Psychological Science 1 (3): 337–56. https://doi.org/10.1177/2515245917747646.
Simmons, Joseph P., Leif D. Nelson, and Uri Simonsohn. 2011. “False-Positive Psychology: Undisclosed Flexibility in Data Collection and Analysis Allows Presenting Anything as Significant.” Psychological Science 22 (11): 1359–66. https://doi.org/10.1177/0956797611417632.
Simonsohn, Uri, Joseph P. Simmons, and Leif D. Nelson. 2020. “Specification Curve Analysis.” Nature Human Behaviour 4 (11): 1208–14. https://doi.org/10.1038/s41562-020-0912-z.
Steegen, Sara, Francis Tuerlinckx, Andrew Gelman, and Wolf Vanpaemel. 2016. “Increasing Transparency Through a Multiverse Analysis.” Perspectives on Psychological Science 11 (5): 702–12. https://doi.org/10.1177/1745691616658637.
Teney, Céline. 2016. “Does the EU Economic Crisis Undermine Subjective Europeanization? Assessing the Dynamics of Citizens’ EU Framing Between 2004 and 2013.” European Sociological Review 32 (5): 619–33. https://doi.org/10.1093/esr/jcw008.
Tyner, Andrew H., Anna Lou Abatayo, Mason Daley, et al. 2026. “Investigating the Replicability of the Social and Behavioural Sciences.” Nature 652 (8108): 143–50. https://doi.org/10.1038/s41586-025-10078-y.
Young, Cristobal, and Erin Cumberworth. 2025. Multiverse Analysis: Computational Methods for Robust Results. Analytical Methods for Social Research. Cambridge University Press. https://doi.org/10.1017/9781009003391.
Feedback
Feedback form
(link in the chat · two minutes)